AI did not end the data literacy crisis. It changed it. As machines move from providing information to interpreting it and recommending what to do, the scarce skill is becoming judgment: knowing what to trust, what to question, and what decisions are still ours to make.
Evidence does not make decisions. People interpret it, weigh it, challenge it, and make judgments. A courtroom reveals what leaders can learn about evidence, expertise, confidence, and data-informed decision-making.
Feeling sure doesn't mean you're right. Learn five simple ways to question what feels true, spot what might be influencing you, and make better decisions about what to believe.
Are better decisions happening? Most data literacy programs fail because organizations refuse to measure what matters. Learn the framework that connects training to real business value.
Most data literacy programs fail not because employees can't think analytically. They fail because organizations refuse to.
The Measurement Trap
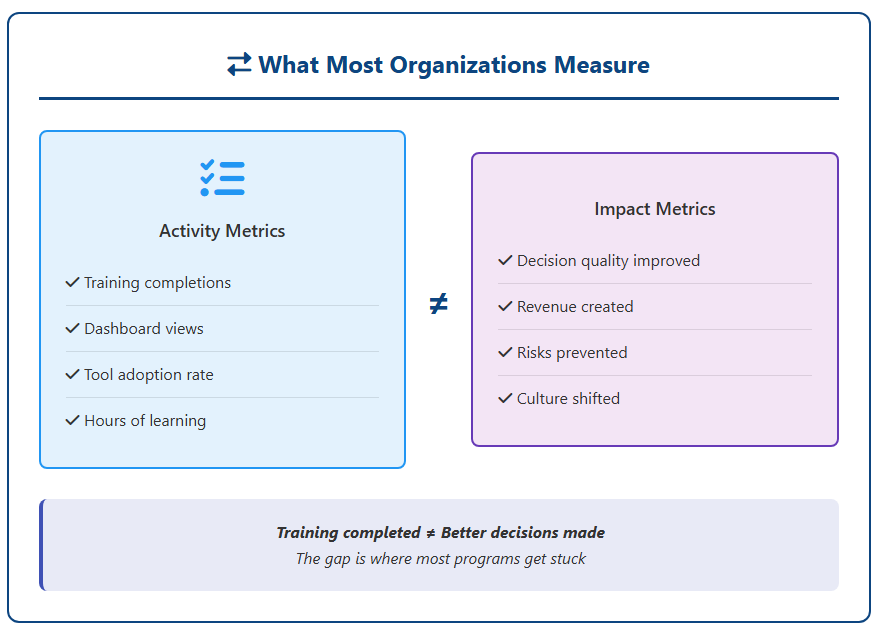
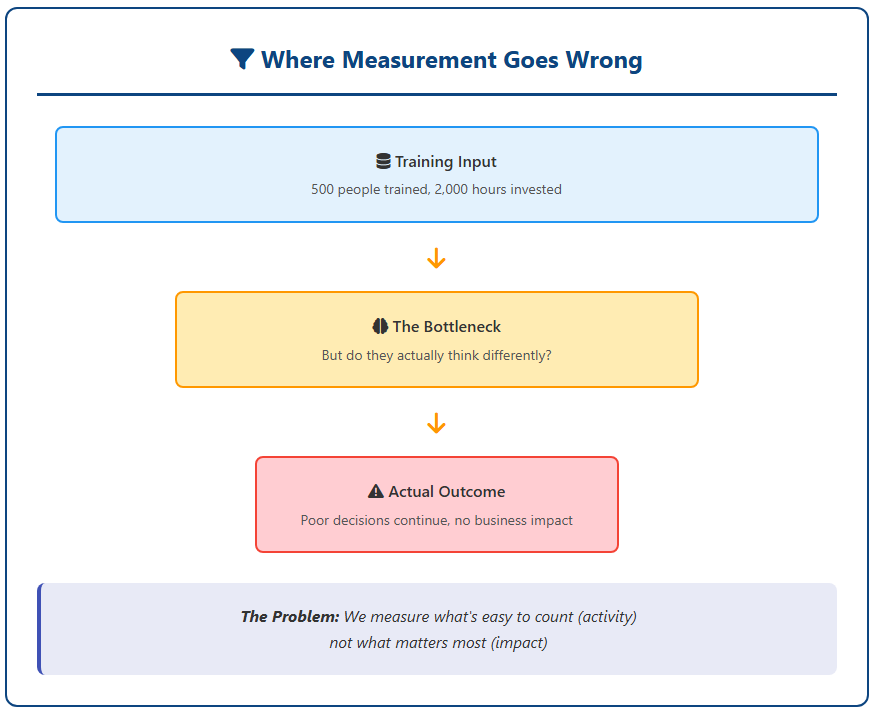
Walk into most organizations and ask about their data literacy program. You'll hear the same metrics over and over: "We trained 500 people." "Dashboard adoption is up 40%." "Our employees completed 2,000 training hours."
These numbers feel like progress. They look impressive in a board presentation. So why do most organizations still make poor decisions despite all that training?
Because we're measuring the wrong things.
The problem isn't that we're tracking metrics. It's that we're confusing activity with impact. Training completion tells you people showed up. Dashboard views tell you they clicked a button. Neither tells you whether the organization is actually making better decisions or creating business value.
Here's the hidden assumption: We believe that more data and more training equal better decision-making. That assumption is backwards. A person can complete all the training in the world and still make terrible decisions. Conversely, someone who understands their role and their customer might make a brilliant decision with minimal data.
The real issue? Organizations are trying to measure data literacy without understanding what they're actually trying to achieve.
Three Different Questions, Three Different Answers
When leaders ask "How do we measure data literacy success?" they're actually asking three separate questions. Most organizations answer only the first one, then wonder why the other two remain invisible.
You can't measure what you refuse to define. And most organizations refuse to define what 'success' actually means.
Question 1: Where Does the Value Come From?
Not all data creates equal value. Data that helps you optimize a process is valuable. Data that helps you identify a new market opportunity is more valuable. Data that prevents a catastrophic risk. That's invaluable.
Before you can measure data literacy impact, you need to understand which business areas matter most. This is where the Value Framework lives. It's the answer to: "In our organization, what outcomes matter?"
Consider revenue growth. A retailer generates new revenue in three ways: acquiring new customers, increasing purchase frequency, or increasing average transaction value. Data literacy affects all three, but in different ways and at different speeds. Understanding these pathways is essential because it changes everything about how you approach the program.
What if your data literacy investment is working beautifully, but you're measuring value in the wrong place?
Question 2: Is Our Program Actually Working?
Even if you know where value comes from, you need to know if your program is delivering it. Are people adopting data-driven thinking? Is decision quality improving? Are behavioral patterns shifting? Is the culture changing?
This is the Effectiveness Index. It's the answer to: "Are we actually making progress?"
Think of it like an airplane's instruments. You don't need to know how many gallons of fuel you have. You need to know the altitude, airspeed, heading, and rate of descent. These dimensions tell you the health of your program without overwhelming you with noise.
Question 3: Can We Connect This to Money?
This is where most organizations get uncomfortable. It's one thing to show that adoption is increasing and decision quality is improving. It's another to trace that back to actual business outcomes and prove a financial return.
This is ROI Attribution. It's the answer to: "How much value did this investment actually create?"
Here's what makes this tricky: you can't just multiply adoption rate by average salary and call it ROI. That's theater. Real attribution requires understanding which decisions were made differently, comparing outcomes of data-informed versus gut-based decisions, and isolating data literacy's contribution from all the other factors that influence business results.
The hard truth: Most organizations can't answer any of these three questions clearly. That's not a measurement problem. That's a thinking problem.
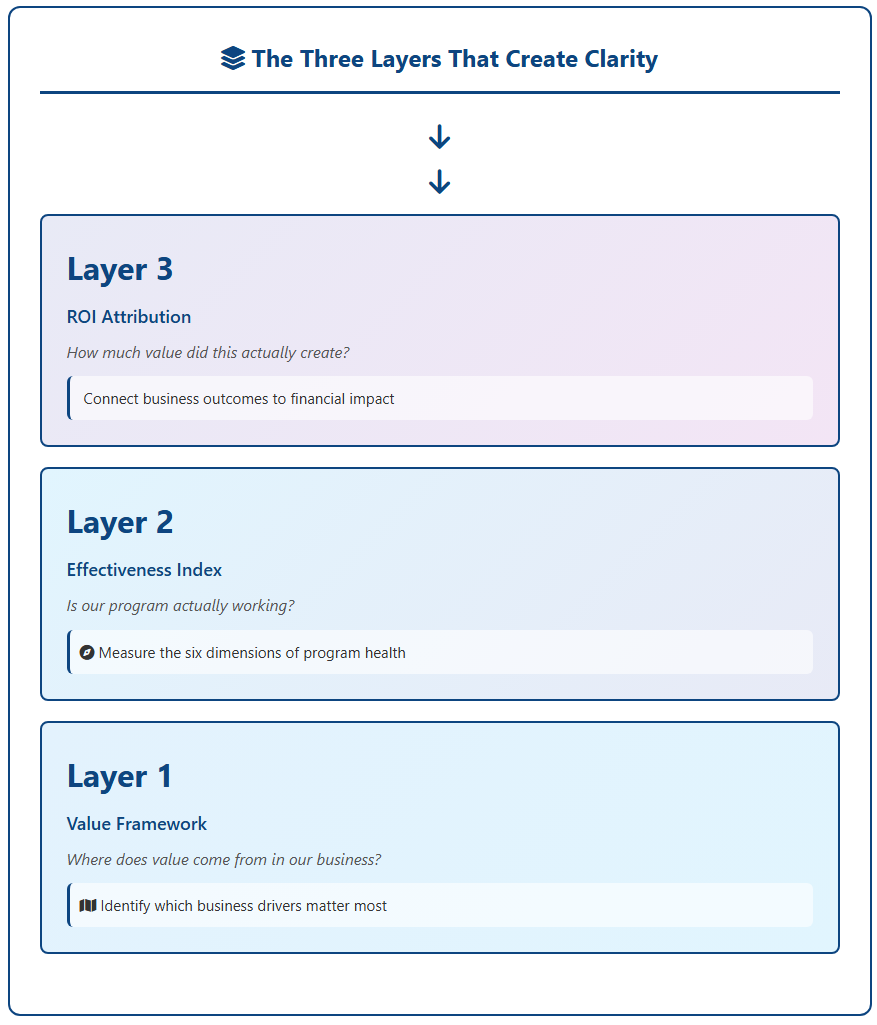
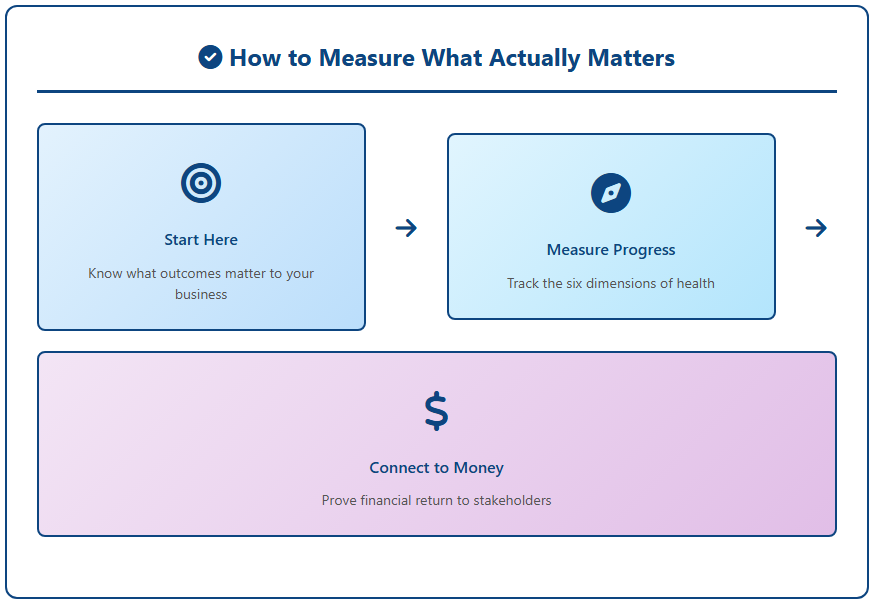
The Three Layers That Create Clarity
Here's what separates organizations that actually move the needle from those that mistake activity for progress.
LAYER 1: Value Framework answers where value comes from across seven business drivers where data literacy creates impact.
LAYER 2: Effectiveness Index reveals how well your program is working through six dimensions measuring real progress.
LAYER 3: ROI Attribution connects business outcomes to financial impact, transforming insight into justification.
Layer 1: The Value Framework
This is your foundation. It answers: "What outcomes matter to our business?"
Data literacy drives value across seven pathways. Operational efficiency means working smarter, reducing waste, automating decisions. Revenue growth emerges from better customer targeting, pricing, and product decisions. Customer experience improves when you understand what customers actually need and deliver it. Risk management lets you see threats earlier and prevent costly mistakes. Competitive intelligence helps you understand your market faster than competitors move. Strategic decision-making puts data in the hands of leadership guiding the organization. Innovation happens when you test ideas systematically and learn from data.
The paradox: We'll spend millions on data infrastructure but zero on cognitive infrastructure. Then we wonder why the data isn't being used.
Not all seven matter equally to your organization. A manufacturing company prioritizes operational efficiency and risk management. A software company prioritizes competitive intelligence and innovation. A financial services firm prioritizes risk and compliance.
The Value Framework forces you to be specific: Which of these drivers should your data literacy program target? What does success look like for each one?
Layer 2: The Effectiveness Index
Now you know where value comes from. The next question: Is your program actually moving those needles?
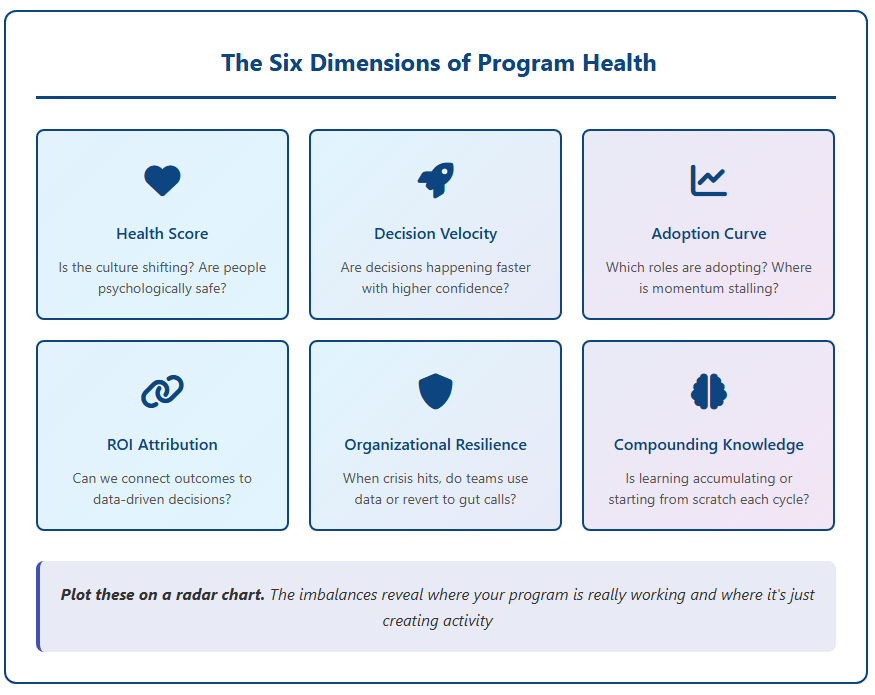
This is where six dimensions come into play. Each one measures a critical aspect of program health.
Health Score reveals whether the culture is shifting. Are people psychologically safe to use data, or are they hesitant and defensive?
Decision Velocity shows whether decisions are happening faster with higher confidence. Speed matters, but not at the cost of quality.
Adoption Curve tells you which roles are adopting data-driven thinking and where momentum is stalling. That's where your real work begins.
ROI Attribution connects business outcomes directly to data-driven decisions. This is where impact becomes visible.
Organizational Resilience answers a crucial question: When things get uncertain, do people make data-informed choices or revert to gut calls? Culture shows itself under pressure.
Compounding Knowledge reveals whether the program is getting more valuable over time or starting from scratch each cycle. Is learning accumulating or evaporating?
These aren't random metrics. Each one reveals something critical about whether your program is actually changing how the organization thinks and acts.
Score each dimension 0 to 100. Combine them into a single composite score. Plot them on a radar chart. Suddenly you see imbalances that raw numbers hide. Maybe your adoption is strong but your resilience is weak, meaning culture changes the moment crisis hits. Maybe your velocity is high but your health score is low, revealing that people are stressed rather than empowered.
Layer 3: ROI Attribution
Two layers up, organizations feel good about progress. People are adopting. Culture is shifting. Decisions are faster.
Then the CFO asks: "What's this worth?"
This is where most organizations stumble. Because real attribution is hard. You can't just say "employees make better decisions, so let's assume 15% better outcomes and multiply by payroll." That's guesswork dressed up as analysis.
Real attribution requires identifying specific decisions made with and without data. It means comparing outcomes of data-informed versus gut-based choices. It demands isolating data literacy's contribution from other factors influencing results. It insists on tracing financial impact back to those individual decisions.
This is embedded in Layer 2 as one of the six dimensions. But it deserves focused attention because it's how you ultimately justify the investment to the people who control resources.
How They Work Together
Here's what separates organizations that actually move the needle from those that mistake activity for progress.
Winners use all three layers together. They say something like this:
"We're targeting revenue growth and operational efficiency. This month, our adoption curve shows strong progress in sales and operations, but customer success is plateauing. We're also seeing that customer-facing teams make decisions 35% faster with higher confidence. When we compare outcomes of data-informed customer decisions to gut calls, we're seeing a 12% higher success rate, which translates to approximately $2.3M in annualized revenue."
That's clarity. That's truth. That's what CFOs understand.
Without all three layers, you're vulnerable. Without Layer 1, you don't know if you're targeting the right outcomes. Without Layer 2, you can't tell if your program is working or just creating busy work. Without Layer 3, you can't prove value to stakeholders who control the resources and make the final call on continued investment.
The framework doesn't solve the problem. But without the framework, you'll never know if the problem is actually solved.
What if the reason organizations struggle to prove ROI isn't because data literacy doesn't create value, but because they're trying to measure it without a framework that actually works?
Why This Matters Right Now
Data literacy investments are under scrutiny. Budgets are tightening. Leaders want proof before they commit more resources.
The real cost of poor measurement isn't wasted training spend. It's the decisions you never even knew were wrong.
The organizations that will actually win are the ones that can clearly answer three questions. What specific business outcomes are we targeting? How do we know our program is working? What's the financial impact?
This framework gives you that clarity. It separates the organizations that are serious about data literacy from those just going through the motions.
In the next article, we'll explore Layer 1 in depth: the Value Framework and where the hidden costs of data illiteracy actually hide in your P&L.
What Happens Next
This article revealed the core problem with how most organizations measure data literacy. Training completions, dashboard adoption, and platform usage make it look like progress is happening. But activity is not impact, and none of those metrics tell you whether decision quality is improving or value is being created.
This is just the start.
You are reading Article 1 of the series Making Data Literacy Count. In this first article, we exposed why traditional measurement fails and introduced the 3 Layer Measurement Framework — the foundation for measuring what actually matters: value, effectiveness, and financial impact.
Here is what comes next.
Article 2: The Hidden Costs You’re Not Seeing We map where data illiteracy silently drains money, time, and opportunity from your organization. You will learn how to use the Value Framework to identify where data literacy can produce measurable impact — and how to prove it.
Article 3: Building a Business Case That Works We walk through how to translate data literacy progress into a business case that leadership and finance will support. You will learn how to tie effectiveness and value directly to ROI so your program becomes easy to fund and hard to cut.
When the series is complete, you will be able to answer three questions every executive cares about:
Where does data literacy value actually come from?
Is our program really working?
Can we prove the financial impact?
This isn’t about training more people. It’s about transforming how your organization thinks, decides, and competes.
If your organization has ever struggled to prove the impact of data literacy, this webinar will show you how to make the value visible.
Kevin is an author, speaker, and thought leader on topics including data literacy, data-informed decisions, business strategy, and essential skills for today. https://www.linkedin.com/in/kevinhanegan/
AI did not end the data literacy crisis. It changed it. As machines move from providing information to interpreting it and recommending what to do, the scarce skill is becoming judgment: knowing what to trust, what to question, and what decisions are still ours to make.
Evidence does not make decisions. People interpret it, weigh it, challenge it, and make judgments. A courtroom reveals what leaders can learn about evidence, expertise, confidence, and data-informed decision-making.
Feeling sure doesn't mean you're right. Learn five simple ways to question what feels true, spot what might be influencing you, and make better decisions about what to believe.
We teach data literacy as a ladder: data at the bottom, wisdom at the top, climb step by step. But the rungs are not where the work happens. The judgment lives in the gaps between them, and that is exactly where AI now carries us straight past.