AI did not end the data literacy crisis. It changed it. As machines move from providing information to interpreting it and recommending what to do, the scarce skill is becoming judgment: knowing what to trust, what to question, and what decisions are still ours to make.
Evidence does not make decisions. People interpret it, weigh it, challenge it, and make judgments. A courtroom reveals what leaders can learn about evidence, expertise, confidence, and data-informed decision-making.
Feeling sure doesn't mean you're right. Learn five simple ways to question what feels true, spot what might be influencing you, and make better decisions about what to believe.
The Averaging Trap: What "Average" Scores Are Hiding About Your Child's Needs
Your child's score says "average." You breathe a sigh of relief. But here's what you don't know: "average" can hide critical weaknesses, mask burnout, and delay help by years. Learn why "average" doesn't always mean "okay" and what's really hiding inside that number.
Strengths don't erase weaknesses. They hide them. And hidden weaknesses only get bigger.
We've established in previous articles in this series that single scores mislead. But here's the specific mechanism of whyand how to spot it when you see it.
When you receive your child's evaluation report, seeing the word "average" can bring a wave of relief. Average sounds safe, predictable, and like "no problem". You might be told, "Your child is doing fine. Their scores are right where they should be," and the case feels closed.
But here is one of the most important concepts for a data-smart parent to grasp: In education, average can sometimes hide the very issues that make learning hard.
This happens because a single number or overall composite score is merely a mathematical shortcut, it takes multiple different skills and combines them into one figure. If you rely only on that comforting average, critical gaps can go unaddressed for years, potentially putting your child at risk for burnout or delayed support.
This article will show you the hidden story, the diagnostic gold, that lies within your child's detailed performance data by revealing how averages are calculated and what they mask.
The Mechanism of the Averaging Trap
To understand why "average" is often misleading, you must first understand how test scores are calculated. Most formal educational and psychological assessments do not provide just one score; they are made up of multiple subtests that measure different, distinct skills. These subtest scores are then combined and averaged into a composite score, which is meant to represent your child's overall ability in an area (like reading or math).
Student B: Scores 99, 99, 50, 98, 95. Average: 88. (Excellent performance, but one major weakness: the 50.)
These two students have the identical average score, but their learning needs are completely different. If you only see the 88, you miss the significant weakness in Student B that requires immediate attention.
This is the averaging trap that happens constantly in schools.
Two students, identical average score of 88. One has consistent strengths. The other has one critical weakness hidden behind excellent performance in other areas. Same number. Completely different needs.
Why Your Child’s Learning Profile is “Jagged”
The idea that a child is "average" assumes that their abilities are flat and consistent across all skills. But the reality of human learning is that ability is multi-dimensional and jagged. Every learner has a unique mix of strengths and weaknesses.
When you look beyond the composite score, you are looking for scatter (the significant variability among subtest scores). High scatter means there are big differences (often 20 or more points) between your child's highest and lowest scores. This uneven profile is often diagnostic gold because it shows where cognition, not just content, creates friction.
If a school system operates on standardized, One-Size-Fits-All programs, a jagged learning profile often leads to the system failing the child, even if the overall scores look acceptable.
One child's performance across five skills. Notice the scatter, the 50-point spread from highest to lowest. That spread is diagnostic gold. The average hides it. The scatter reveals it.
The Two Most Dangerous Averaging Scenarios
Parents must learn to spot two critical scatter patterns where strengths actively hide significant weaknesses, masking the need for support:
1. The Compensating Profile
This pattern occurs most often in cognitive assessments (like an IQ test), where a child’s superior intellectual abilities mask underlying processing challenges.
The Scores: A child might score in the 95th percentile for Verbal Reasoning but only in the 25th percentile for Working Memory or Processing Speed.
The Resulting Average: The overall cognitive composite score may land right in the "average range" (e.g., 50th percentile).
What it reveals: This child is using their intellectual strengths (like strong vocabulary and reasoning) to compensate for slowness or difficulty juggling information mentally.
The Risk: For a bright, curious child, consistent "average" scores may actually represent a relative weakness or under-support compared to their potential. This child is working much harder than their peers to achieve the same results. Over time, this sustained effort to maintain "average" performance leads to burnout, increasing anxiety, and eventually a possible decline in scores when compensation strategies fail to keep up with increased academic demands. They need accommodations tied to their processing weaknesses (like extended time), even with an "average" composite score.
A bright child using verbal strength (95th percentile) to mask processing weakness (25th percentile). The composite? 50th percentile. Average looks fine. The child is burning out trying to maintain it.
2. Average by Cancellation
This pattern occurs when strengths in one academic area are numerically balanced out by weaknesses in another, making the overall average appear misleadingly acceptable.
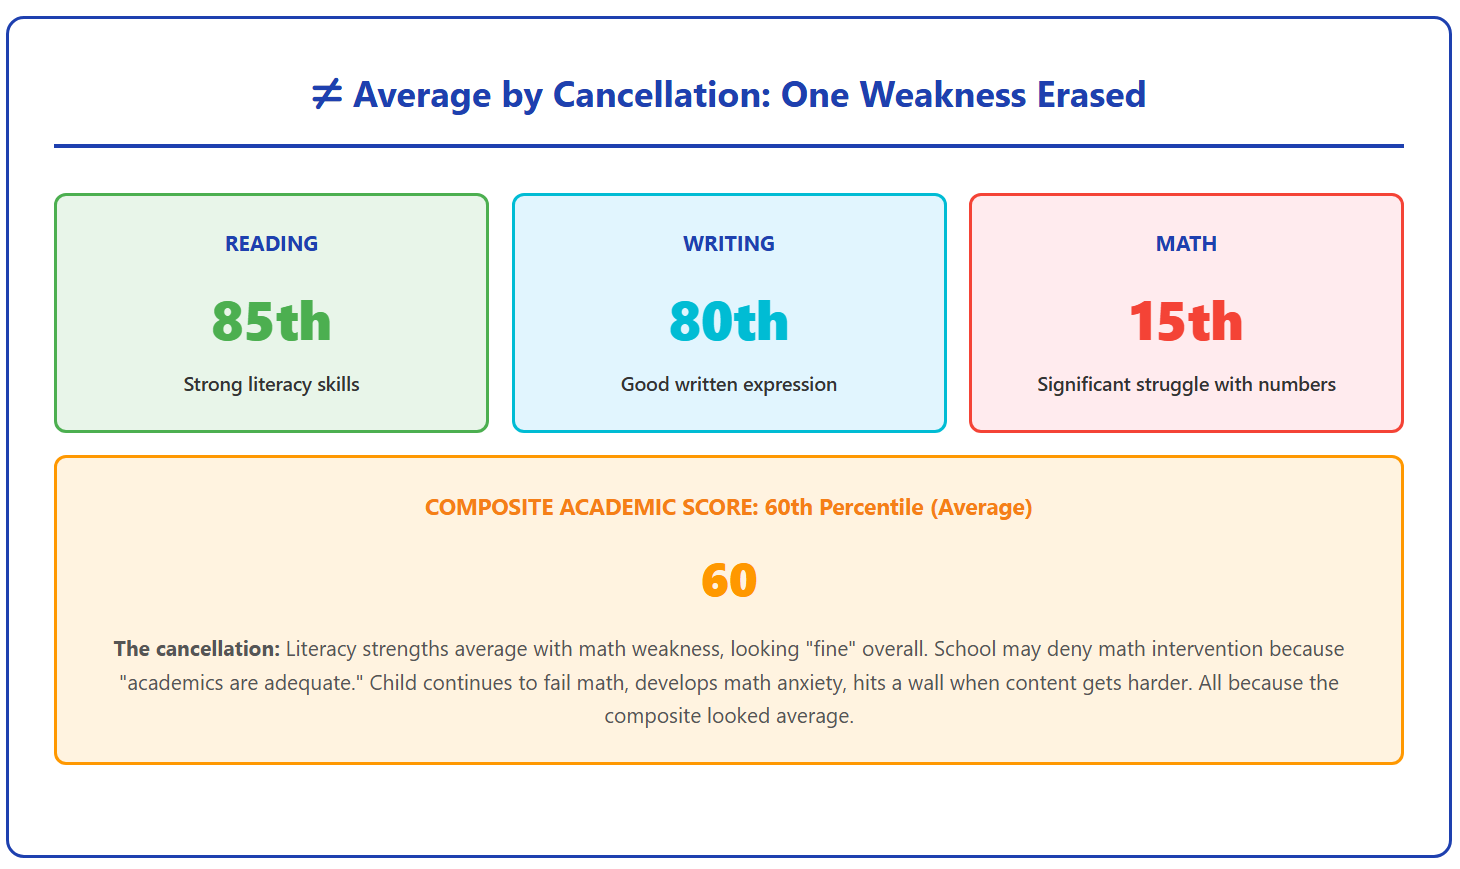
Strong reader (85th). Good writer (80th). Struggles significantly with math (15th). Average academic score: 60th percentile. School says "academics are fine." Math intervention gets denied. The problem stays invisible until it's a crisis.
The Scores: A child might score in the 85th percentile for Reading and 80th percentile for Writing, but the Math score is 15th percentile.
The Resulting Average: The overall Academic Composite score may still fall in the average range (e.g., 50th percentile).
What it reveals: The child has a significant weakness in one core academic area (like math), but their literacy strengths have cancelled out the deficit in the overall score.
The Risk: This child will fail math tests and develop anxiety around numbers. But because the overall academic score is “fine,” the school may deny targeted math intervention, believing that the overall academics are adequate. The individual strengths (e.g., strong vocabulary) may even mask a weakness in a sub-skill (e.g., decoding) within the same subject area. The child might hit a wall when "learning to read" becomes "reading to learn" because foundational skill deficits were missed when the composite score looked high.
The High Cost of Ignoring the Hidden Pattern
When parents accept an average score without looking underneath, the consequences are often borne by the child:
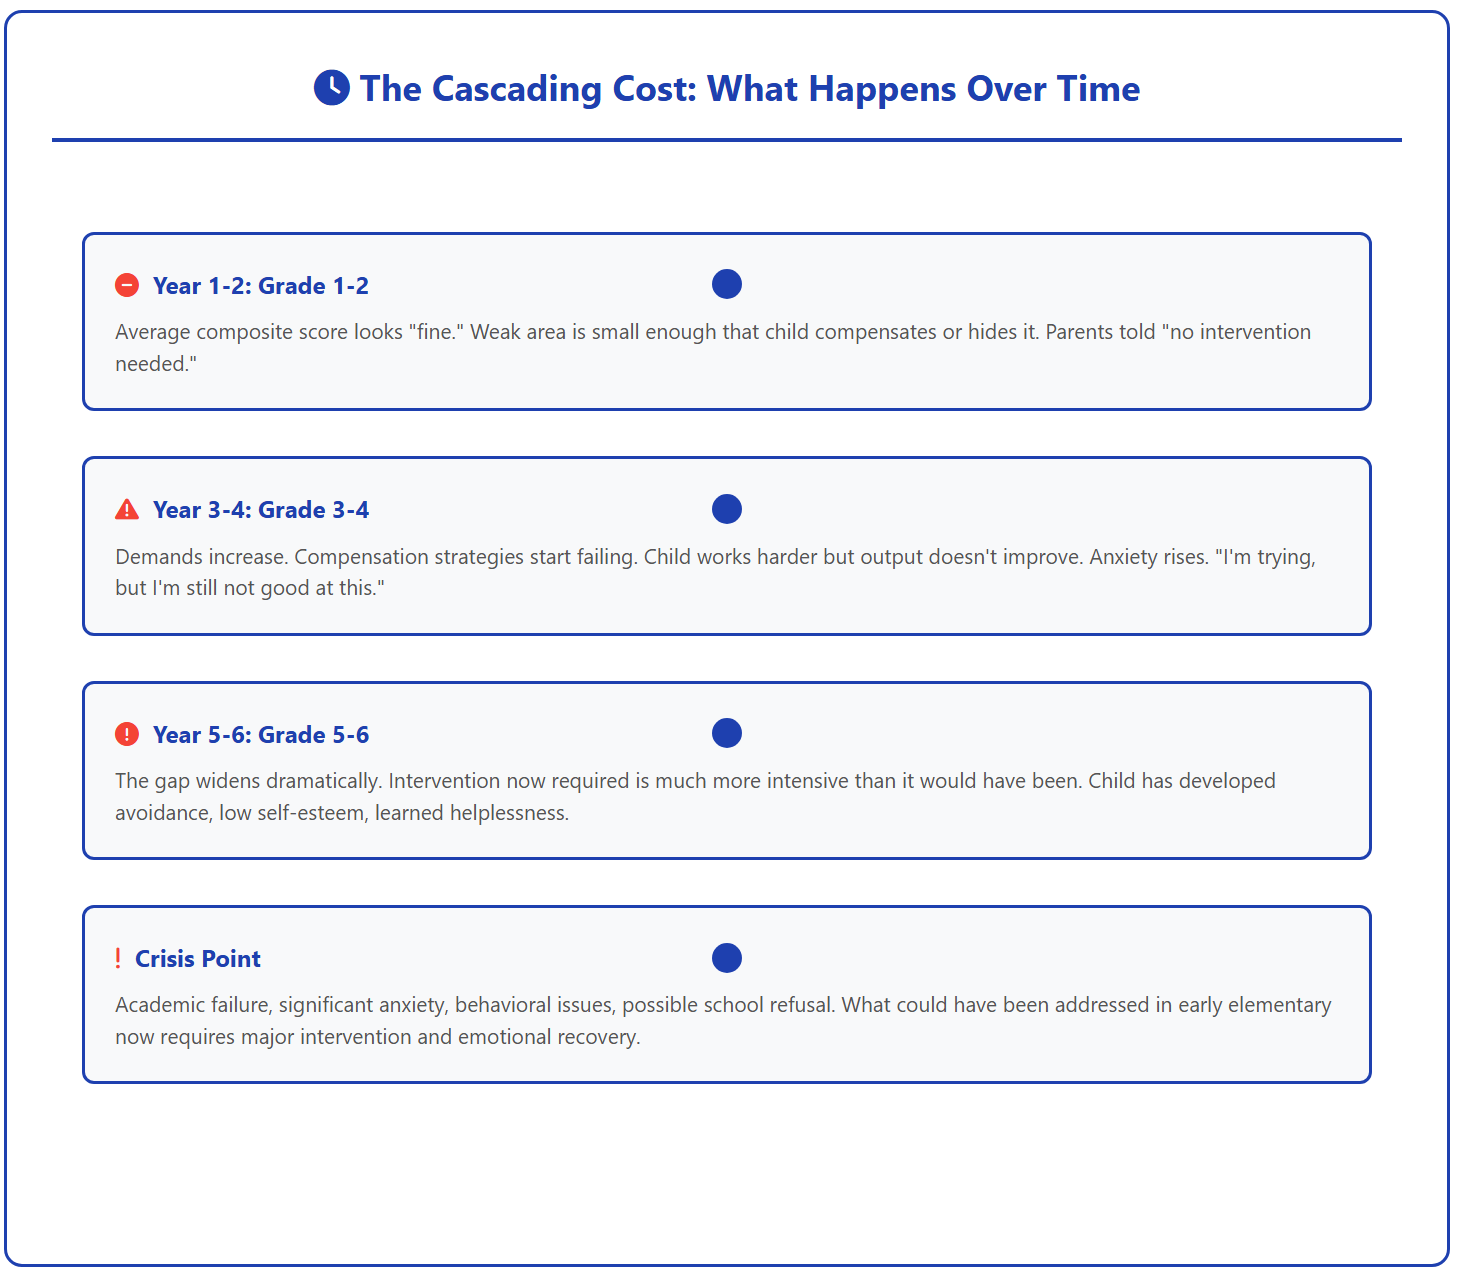
Missed Intervention Windows: Early intervention is most effective. If a weakness is masked by an average composite score, the critical time for addressing foundational skills may be lost.
Widening Gaps: Academic expectations increase every year. A compensating child who appears "average" in 3rd grade will likely find that their skills are insufficient to meet 5th or 7th grade demands, leading to a much larger problem later.
Emotional Distress: Children know when they are struggling more than their peers. When adults tell them they are "fine" based on average scores, they may internalize the struggle, leading to anxiety, low self-esteem, and avoidance behaviors.
Years 1-2: Looks fine. Years 3-4: Cracks appear. Years 5-6: Crisis. This is what happens when you accept the average without looking underneath. Early intervention could have prevented all of this.
Your Advocacy Hook: Demand to See the Subtests
As the parent, your advocacy journey requires you to reject the simple composite score as the final verdict. You must position yourself as a co-interpreter of the data, using your observations to challenge conclusions that do not align with reality.
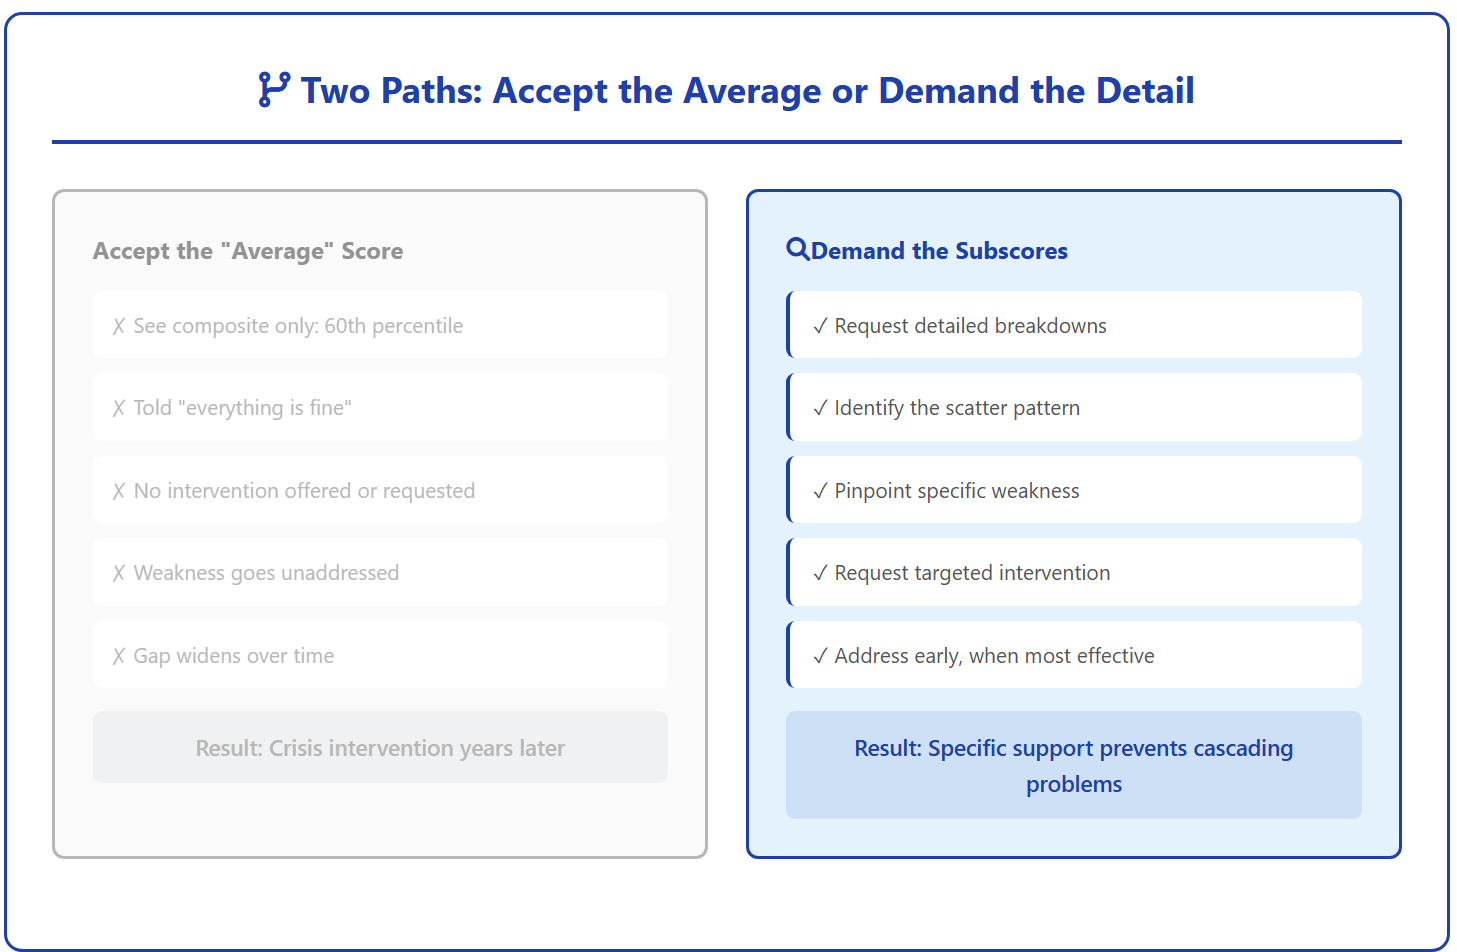
One path leads to crisis years later. One path leads to early, targeted intervention. The difference? Asking one question: "Can I see the subscores?"
Parents must never accept a composite score without seeing the subtest scores.
When you receive an evaluation, treat any average score that contradicts your observations as a red flag that warrants a second look.
The difference between a child getting help and a child in crisis is often just one parent who asked: 'Can I see the subscores?
How to Request and Interpret the Detail
You have the right to review the detailed breakdowns, index scores, and sub-scores in assessment reports. When meeting with evaluators, here are the essential questions to guide your detective work:
"What is the range of subtest scores that went into this composite?" You need the actual numbers (percentile ranks and standard scores) for each individual subtest.
"What is the difference between my child's highest and lowest subtest scores?" Use the specific number (e.g., 70-point difference) to make your case.
"Can you help me understand what this scatter pattern indicates about my child's learning profile?" Ask the evaluators to explain the gaps.
"Do you see evidence that my child is compensating for weaknesses with strengths?" If the evaluator agrees, you have proof that supports are needed to manage the high effort required to maintain performance.
Use your observations (your "data") to connect the score scatter to real-world struggles. For instance, if the subtest data shows a low score in math fluency (e.g., 15th percentile), you can link that to your daily data: "While the overall score is average, the 15th percentile in math fluency explains why homework that should take 20 minutes is actually taking 90 minutes. This is causing significant anxiety".
This approach ensures that you are using data not as proof of a deficit, but as a basis for alternative solutions tailored to your child’s unique pattern of learning.
The Bottom Line: Moving from Average to Accuracy
Averages are designed to describe populations, not people. Your child’s performance is highly variable and depends on conditions, context, and the alignment of the task to their skills.
The next time someone tells you your child’s scores are "average," remember that the true picture of your child’s learning story, their unique jagged profile, is hidden beneath the surface. By insisting on seeing the subtest scores and understanding the scatter, you transform yourself from a passive recipient of data into an informed advocate who is prepared to push for the fit, not the fix.
This is how you ensure that the support your child receives matches the reality of how they learn, rather than just the simplicity of a score.
A test score is like an average weather forecast for an entire state. It might say "sunny and 70 degrees," but that average hides the fact that one city is experiencing a severe thunderstorm (the weakness) while another is enjoying a perfect day (the strength). You must look at the specific city, the subtest, to know whether your child needs an umbrella or sunscreen.
Next in the Series
Uncovering the "Why": How Your Child Solves Problems Matters More Than the Answer. You'll learn why the process of how your child thinks is just as important as whether they get the right answer, and how to use that insight to help your child learn better.
Kevin is an author, speaker, and thought leader on topics including data literacy, data-informed decisions, business strategy, and essential skills for today. https://www.linkedin.com/in/kevinhanegan/
Feeling sure doesn't mean you're right. Learn five simple ways to question what feels true, spot what might be influencing you, and make better decisions about what to believe.
When an institution cites a measurement you cannot see, it hands you a conclusion and calls it evidence. Two World Cup rulings show why that gap matters far beyond sport, and why the fix is not better technology but a different question.
When kids ace drills but break down on word problems, it’s not effort or ability, it’s cognitive load. This article explains how executive function demands overwhelm capacity, and how the right scaffolds restore access to learning.
When school reports say "fine" but your child struggles daily, that gap is real. Your observations aren't anecdotal, they're longitudinal evidence. This journey helps you trust what you see, complete the data schools collect, and advocate with grounded confidence. Start here.