AI did not end the data literacy crisis. It changed it. As machines move from providing information to interpreting it and recommending what to do, the scarce skill is becoming judgment: knowing what to trust, what to question, and what decisions are still ours to make.
Evidence does not make decisions. People interpret it, weigh it, challenge it, and make judgments. A courtroom reveals what leaders can learn about evidence, expertise, confidence, and data-informed decision-making.
Feeling sure doesn't mean you're right. Learn five simple ways to question what feels true, spot what might be influencing you, and make better decisions about what to believe.
The Three Data Traps: Why Smart People Make Bad Decisions With Good Data
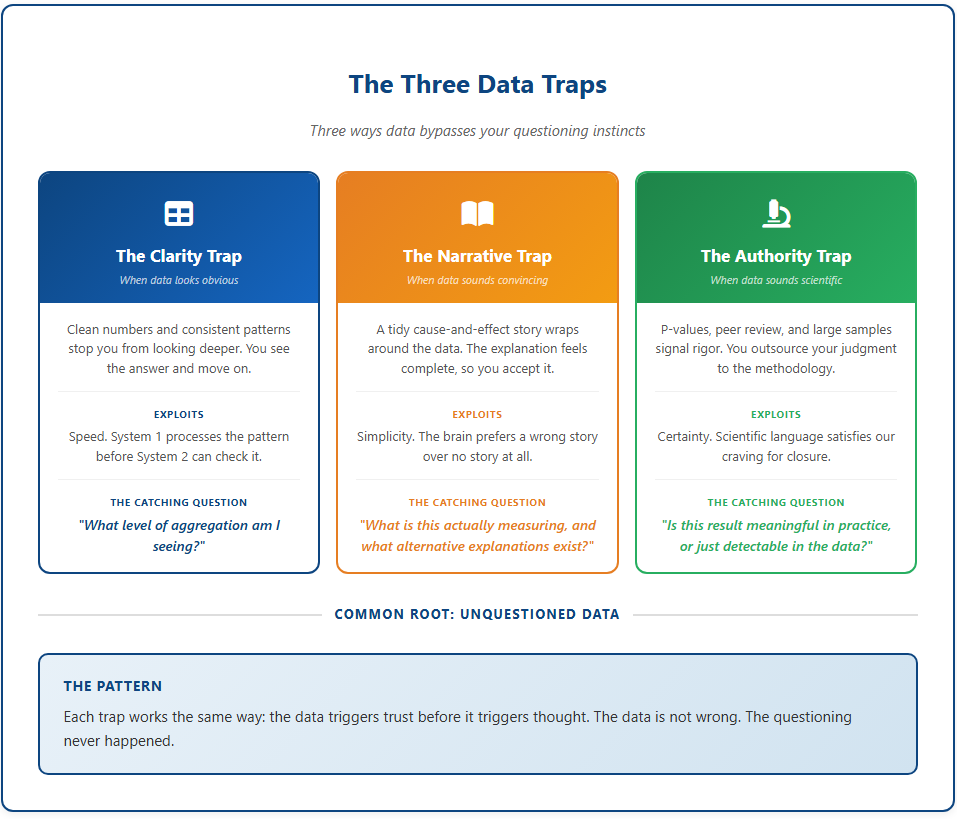
The data was not wrong. The questions were never asked. Three cognitive traps cause smart people to trust data they should question: the Clarity Trap, the Narrative Trap, and the Authority Trap. Learn the single question that catches each one.
The most dangerous data in your organization is not the data that's wrong. It's the data that's right enough to stop you from asking questions.
90 Second Wisdom Audio Brief
0:00
/100.728163
What You Need To Know
Most data failures are not caused by bad data. They are caused by data that looks trustworthy enough to bypass scrutiny. Three specific cognitive patterns cause smart, experienced people to skip the questions that would have changed their decision. These patterns are predictable, and each one can be interrupted with a single question asked at the right moment.
Why This Matters to You Every time you act on a chart, a metric, or a research finding without questioning it, you are making a bet that the surface-level story is the whole story. It usually is not. The cost is not just a wrong analysis. It is a wrong decision, made with confidence, defended with data, and discovered too late. The risk is highest when the data feels most obvious, because that is precisely when your questioning instincts shut off.
Who This Applies To This applies to anyone who makes decisions informed by data, whether you are reviewing a dashboard, evaluating a pilot program, interpreting survey results, or acting on a research study. It is especially relevant if you are in a position where others bring you data and expect a decision. The traps do not target the inexperienced. They target the confident.
What You'll Gain from Reading You will be able to name and recognize the three situations where data is most likely to bypass your judgment. You will have one diagnostic question for each, practical enough to use in your next meeting. More importantly, you will begin to notice the moment your brain accepts data without questioning it, which is the moment that actually determines whether your decision will be good or bad.
Most bad decisions don't come from bad data. They come from data that was never questioned. This is the part that makes smart people uncomfortable. We like to believe that if the numbers are right, the conclusions must be too. That if the chart is clean, the insight is clear. That if the methodology is rigorous, the recommendation is sound.
But data is not truth. It is a representation. And representations can mislead without being wrong.
Over the years, I have watched skilled analysts, experienced leaders, and well-meaning teams make consequential decisions on data that looked right, sounded convincing, and felt scientific. The data was fine. The thinking was not.
The problem is not incompetence. The problem is that certain kinds of data bypass our questioning instincts entirely. They trigger trust before they trigger thought.
A well-made counterfeit bill does not get caught because someone inspects it carefully and decides it's real. It gets caught because someone inspects it at all. Most counterfeits pass because no one holds them up to the light. Data works the same way. The most misleading numbers are not the ones that fail inspection. They are the ones that never get inspected.
I have come to see three distinct traps:
The Clarity Trap — When data looks obvious... and stops you from questioning it.
The Narrative Trap — When data tells a clean story... and you accept it too quickly.
The Authority Trap — When data sounds scientific... and you stop thinking for yourself.
Each one works differently. Each one exploits a different cognitive shortcut. And each one can be caught with a single question, if you know to ask it.
The Clarity Trap
When data looks obvious... and stops you from questioning it.
The Clarity Trap activates when the numbers appear straightforward. Clean table. Clear comparison. Obvious conclusion. Your brain processes it, nods, and moves on. Consider this scenario.
A university is reviewing admissions data by department. In Engineering, men are admitted at 80%, women at 70%. In Humanities, men are admitted at 60%, women at 50%. In every department, men are admitted at higher rates.
The conclusion seems inescapable: women are being admitted at lower rates than men. Now look at the overall admission rate. Men: 68%. Women: 72%. Women are admitted at a higher overall rate. Not lower. Higher.
This ends the free preview.
The rest of this
content is for paid subscribers
Become a paid subscriber to get full access and unlock all paid content.
AI did not end the data literacy crisis. It changed it. As machines move from providing information to interpreting it and recommending what to do, the scarce skill is becoming judgment: knowing what to trust, what to question, and what decisions are still ours to make.
Evidence does not make decisions. People interpret it, weigh it, challenge it, and make judgments. A courtroom reveals what leaders can learn about evidence, expertise, confidence, and data-informed decision-making.
Feeling sure doesn't mean you're right. Learn five simple ways to question what feels true, spot what might be influencing you, and make better decisions about what to believe.
We teach data literacy as a ladder: data at the bottom, wisdom at the top, climb step by step. But the rungs are not where the work happens. The judgment lives in the gaps between them, and that is exactly where AI now carries us straight past.