AI did not end the data literacy crisis. It changed it. As machines move from providing information to interpreting it and recommending what to do, the scarce skill is becoming judgment: knowing what to trust, what to question, and what decisions are still ours to make.
Evidence does not make decisions. People interpret it, weigh it, challenge it, and make judgments. A courtroom reveals what leaders can learn about evidence, expertise, confidence, and data-informed decision-making.
Feeling sure doesn't mean you're right. Learn five simple ways to question what feels true, spot what might be influencing you, and make better decisions about what to believe.
Beyond the Grade: Why One Test Never Tells the Whole Story
Your child's test looks average. But their classroom work shows struggle. The teacher says one thing. You see another. These aren't contradictions, they're clues. Learn how to see the full picture when different sources of information about your child don't match up.
When data sources disagree, most systems treat it as a problem to resolve. Smart advocates treat it as a clue to follow.
In a previous article, we introduced the idea that single scores hide the full picture. Now let's dig deeper into how you actually build that complete picture through triangulation.
When the numbers delivered by the school feel like they contradict the patterns you see every day, you are not imagining things. You are noticing that a single piece of data is failing to capture the rich, complex reality of your unique child.
As we learned in the previous article, becoming data-smart means being a translator: interpreting scores through the lens of lived experience. The first rule of this translation is simple: no single data point can capture the full picture of how your child learns, thinks, or performs.
The Danger of the Single Score Trap
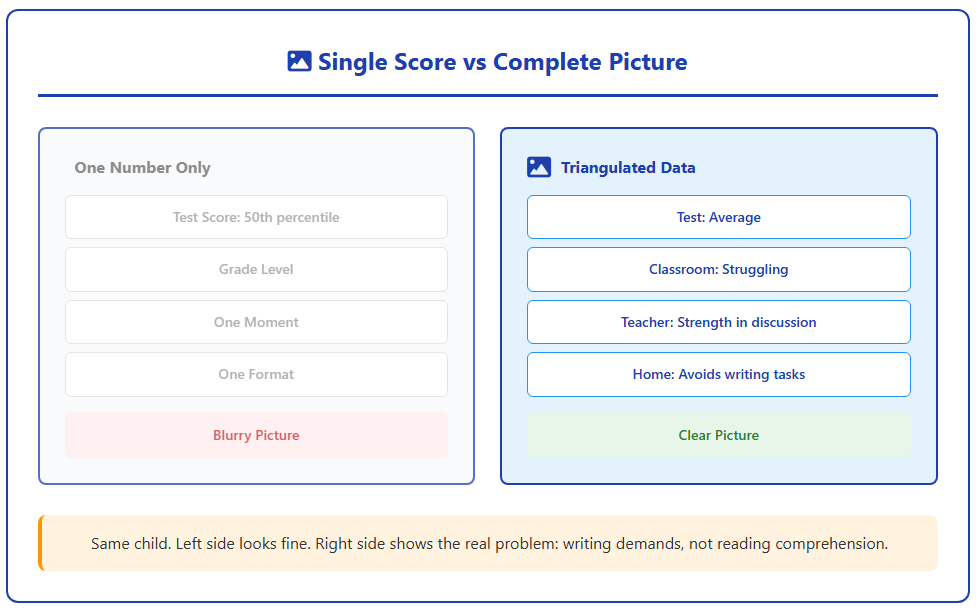
We often fall into the trap of treating individual test scores or grades as the definitive, final word on our child's abilities. Think of it like this: If you were trying to understand someone's overall health, you wouldn't rely solely on their blood pressure. That single number is important, but it misses crucial context about their diet, stress levels, energy, and overall well-being.
Same child. Left shows one number. Right shows four sources. The difference between a blurry picture and a clear one is the same difference between confusion and understanding.
The same principle applies in education. A grade or a standardized score is only a narrow slice of performance, collected under tightly controlled conditions. Relying only on a single number can hide significant struggles masked by averages, overlook crucial processing challenges, and fail to capture the consistency of daily struggle. If you only look at one number, you risk missing the very information needed to unlock appropriate support.
The Power of Triangulating Data: Multiple Lenses, Clearer Picture
To get a complete and accurate understanding of your child, you must employ data triangulation. This is a technical term for a simple, common-sense concept: using three or more different sources of information to understand a situation more completely. Triangulation means you are intentionally looking at your child's performance through multiple lenses to build a comprehensive profile.
Each lens sees something the others miss. One lens is clarity about one angle. Four lenses reveal three-dimensional truth.
When you combine data from various settings and perspectives, patterns emerge that a single test score cannot reveal.
This is where understanding emerges. Not in any single source. But at the intersection where multiple perspectives converge.
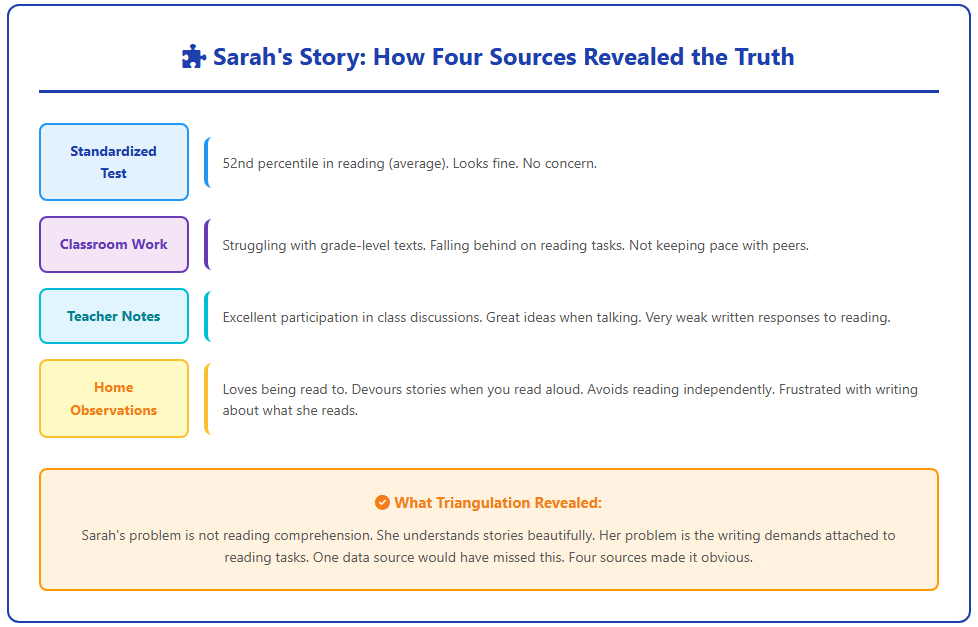
Consider the example of Sarah, a fourth-grader. Her parents were told she was "performing at grade level" based on a single state test score. However, when they looked deeper, the data told a different story:
Standardized Test: 52nd percentile in reading (average)
Classroom Assessments: Struggling with grade-level texts
Teacher Observations: Great participation in discussions, but difficulty with written responses
Home Observations: Reads for pleasure, but avoids homework requiring writing
The "average" test score was masking the fact that Sarah was struggling not with comprehension, but with the specific writing demands often tied to reading tasks in school. This synthesis of information led to the right intervention.
One data source says average and fine. Four data sources say: writing is the barrier, not reading. This is what triangulation makes visible.
Composite scores are how we turn a complex child into a simple number. Then we act surprised when the simple number doesn't match the complex reality.
Red Flags: When Test Scores Don't Match Reality
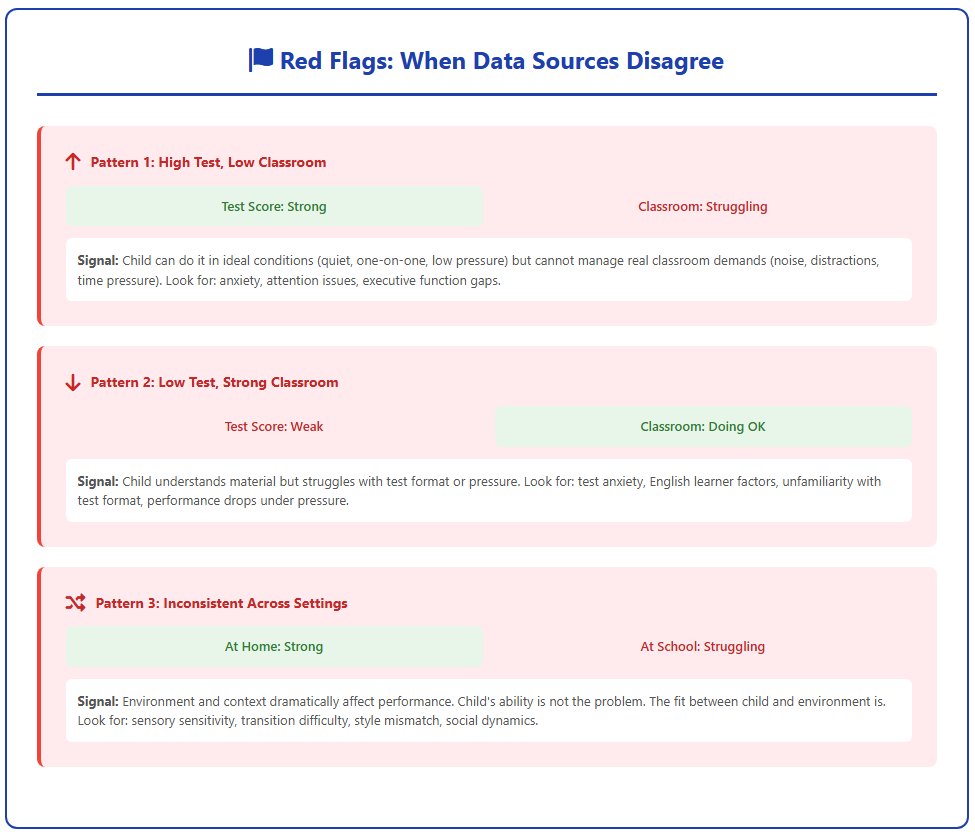
When data from these four sources doesn't align, it is not a contradiction; it is a clue. That valuable discrepancy is a red flag that demands deeper investigation.
High Test Scores, Poor Classroom Performance: This may signal anxiety, attention issues that don't affect one-on-one testing, or difficulty with sustained attention and organization, issues that are masked under ideal testing conditions.
Low Test Scores, Strong Real-World Performance: This often points to test anxiety, discomfort with timed assessments, or language factors that impact test performance but not actual understanding.
Inconsistent Performance Across Settings: If your child excels in small groups but struggles in whole-class instruction, it suggests environmental factors (noise, distractions) or different cognitive demands are affecting performance.
When different sources tell different stories, you haven't found a problem. You have found a clue. These three patterns show what each red flag is signaling.
Your parental role is to bring this lived evidence to the table, linking the contextual data to the testing data to create a fuller picture of how your child functions across settings.
Your Advocacy Hook: You Complete the Story
Advocacy works best when it's built on a complete set of facts. Intentionally triangulating data will move you from feeling like a passive recipient of scores to an active co-interpreter of your child’s learning profile.
The data you hold, the daily observations, the context, the effort, the anxiety, is essential. It fills the gaps that standardized tests leave open, ensuring that the supports designed for your child are accurate and effective.
The difference between 'my child is struggling with reading' and 'my child needs help with written responses to reading' is the difference between vague frustration and actionable insight.
Remember: The ultimate goal is to understand your child’s unique learning profile so that the education system can adjust to fit their needs, rather than expecting them to fix themselves to fit the system.
Kevin is an author, speaker, and thought leader on topics including data literacy, data-informed decisions, business strategy, and essential skills for today. https://www.linkedin.com/in/kevinhanegan/
Feeling sure doesn't mean you're right. Learn five simple ways to question what feels true, spot what might be influencing you, and make better decisions about what to believe.
When an institution cites a measurement you cannot see, it hands you a conclusion and calls it evidence. Two World Cup rulings show why that gap matters far beyond sport, and why the fix is not better technology but a different question.
When kids ace drills but break down on word problems, it’s not effort or ability, it’s cognitive load. This article explains how executive function demands overwhelm capacity, and how the right scaffolds restore access to learning.
When school reports say "fine" but your child struggles daily, that gap is real. Your observations aren't anecdotal, they're longitudinal evidence. This journey helps you trust what you see, complete the data schools collect, and advocate with grounded confidence. Start here.