Greatness is debated endlessly in sports and business but without clear measures, it’s just noise. This article breaks down the formula for true greatness: peak performance, sustained excellence, and adaptability.
Traditional logic assumes certainty. AI gives you probabilities. Our brains are wired for yes-or-no answers, but we got a world of 'maybe-probably.' The rules changed from deterministic to probabilistic, but our reasoning didn't evolve. Learn why your old thinking tools feel brittle.
You're trained in inductive and deductive logic, but your AI gives you 78% confidence scores and your data conflicts. Traditional reasoning breaks down with modern complexity. Learn why smart leaders need Integrated Reasoning to handle uncertainty and make better decisions.
Metrics Without Mindset. 5 Signs Your Data Strategy Needs a Mid-Game Adjustment
The Boston Celtics are losing not because they ignored analytics, but because they used them without context. This article explores the danger of blindly following data and the critical difference between being data-driven and truly data-literate.
The most dangerous use of data isn’t ignoring it. It’s applying it without understanding.
High-Level Summary and Key Takeaways
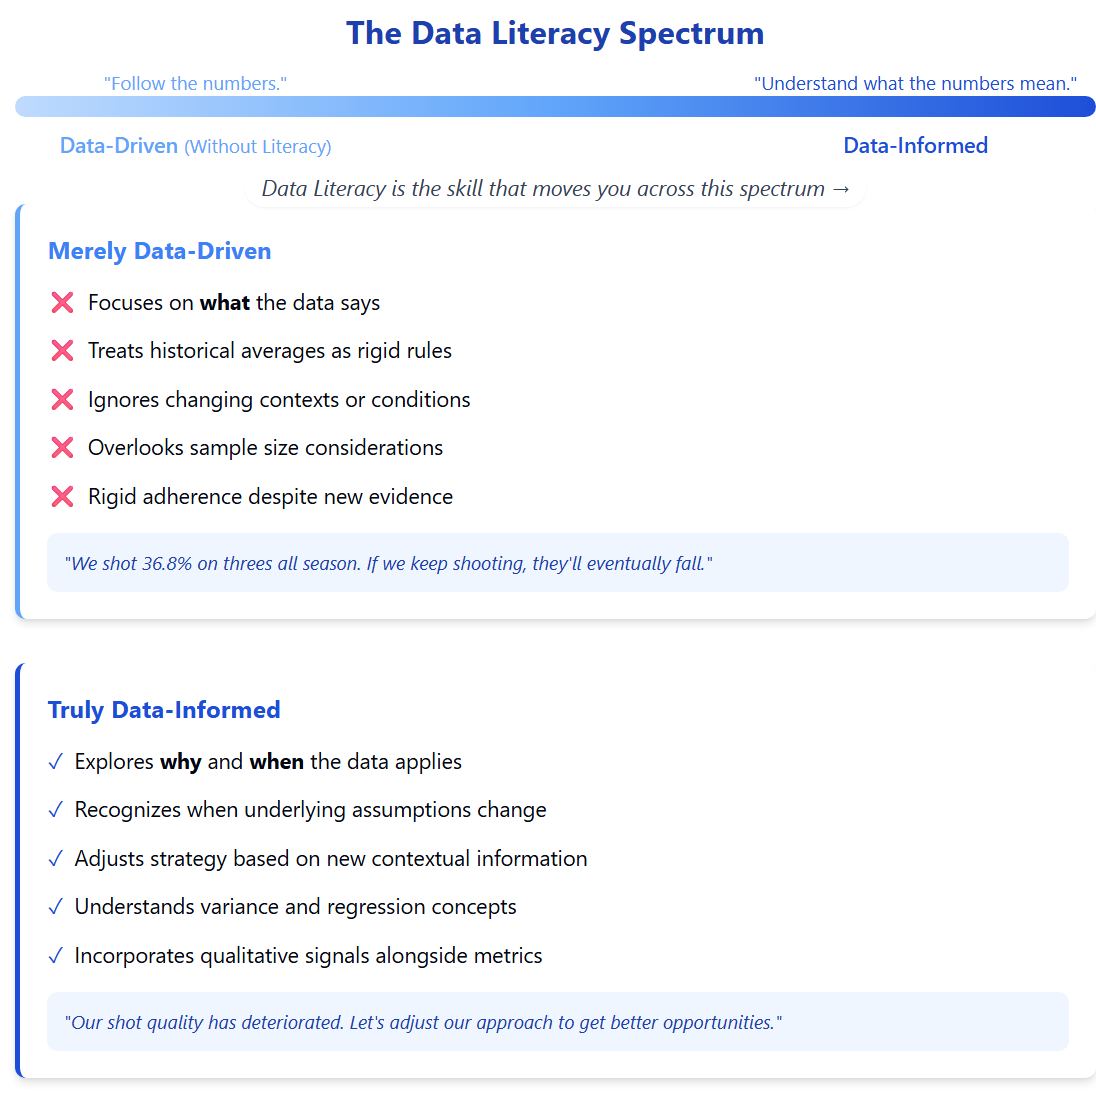
When data-driven strategies fail, the problem often isn't ignoring analytics, it's applying them without context. The Boston Celtics exemplify this challenge, rigidly maintaining their three-point strategy despite significantly diminished returns in playoff scenarios. Their three-point percentage dropped from 36.8% to 25%, costing them an estimated 21 points in Game 1 alone.
This illustrates a crucial distinction between being merely data-driven and truly data-informed. Moving from the former to the latter requires data literacy: the ability to interpret numbers within changing contexts.
True data literacy involves five key practices: using analytics to inform strategy rather than dictate it; recognizing when shot quality and rhythm matter more than historical averages; accounting for human elements invisible in the data; understanding when alternative approaches (like drawing fouls) might deliver better results; and maintaining flexibility as conditions change.
Companies face parallel challenges when rigidly following outdated data strategies. An e-commerce firm might continue investing in a previously successful ad channel despite diminishing returns, failing to adapt as market conditions evolve.
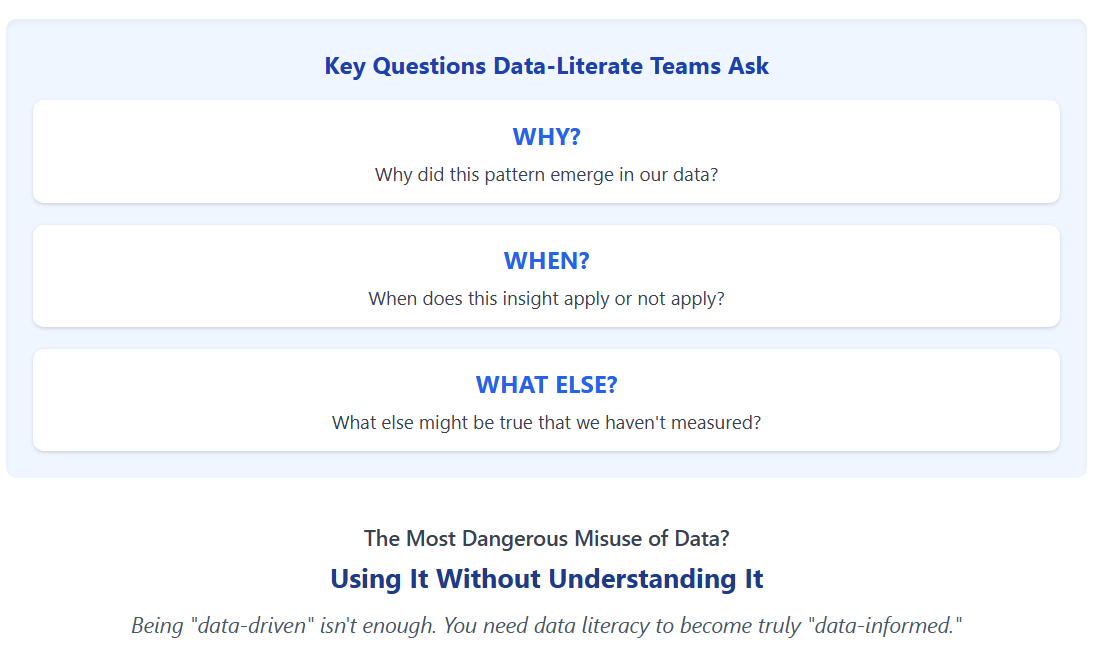
The most dangerous data misuse occurs when teams follow numbers without understanding their limitations. Data-literate organizations ask critical questions about why patterns exist, when insights apply, and what else might be true beyond the measured metrics.
Whether in basketball or business, success comes from using data as a compass, not a cage, knowing when to change the play because the moment demands something different.
Key Takeaways
Data literacy is the critical skill that transforms being data-driven into being truly data-informed. Organizations that only follow numbers without understanding their context risk making poor decisions when conditions change.
Sample size matters significantly when applying data. The statistical reliability of 82 regular season games doesn't automatically transfer to a 7-game playoff series, requiring different analytical approaches for different timeframes.
The best data-informed decisions integrate both quantitative metrics and qualitative signals. Factors like fatigue, confidence, and rhythm, which don't appear directly in the data, often determine success or failure in high-stakes situations.
Analytics should serve as a compass, not a cage. Data should guide strategy while allowing flexibility to adapt when real-time feedback indicates the original approach isn't working.
Organizations must regularly question underlying assumptions in their data. When conditions change, the contexts that made historical data valid may no longer apply, requiring teams to recognize when to pivot rather than persist with previously successful strategies.
The Boston Celtics have become a symbol of modern, analytics-driven basketball. Like many NBA teams, they've embraced the math: three-pointers, even with a lower shooting percentage, yield more points per shot than most two-pointers. Over time, the data supports this. It's helped them build an elite roster, win a championship, and dominate regular seasons.
But the playoffs are not the regular season. And data without context can quickly become a liability.
In their current series against the New York Knicks, Boston has struggled through the first two games. Their shots from deep aren't falling, and yet the strategy doesn't budge. Rather than adjust, they keep firing from three. This isn't a flaw in analytics, it's a flaw in the application of analytics. And it reveals a key truth in both sports and business: being data-informed means knowing when the data no longer applies the way it used to.
Boston Celtics - Three-Point Crisis in the Second-Round of the Playoffs
3-Point Attempts vs. Percentage
Expected Points Per Possession (PPP)
Key Impact - Game 1 vs. Regular Season
-21
Total Points Lost
-0.35
PPP Decrease
↓32%
Efficiency Drop
Key Impact - Game 2 vs. Regular Season
-14
Total Points Lost
-0.35
PPP Decrease
↓32%
Efficiency Drop
Data-Driven Insight
Despite varying their 3-point attempt rate across Games 1 and 2, the Celtics' consistently poor shooting efficiency has resulted in a dramatic loss of offensive production in both games. This illustrates what we are talking about in the article. Data without context becomes a liability when conditions change. The law of averages that works over an 82-game season doesn't necessarily apply in a compressed playoff series.
The Most Dangerous Misuse of Data? Using It Without Understanding It
This isn't a case of a team ignoring analytics, it's more unsettling than that. The Celtics are following the data. The problem is, they're following it without nuance. Without context. Without the literacy needed to recognize when the underlying assumptions: shot quality, confidence, opponent adjustments have changed.
In many organizations, this is the real threat: not data denial, but data misuse by well-meaning teams who never learned how to adapt. They know the numbers but not the caveats. They trust the averages, but not the volatility. They fail to grasp concepts like regression to the mean, or how a short playoff series requires different thinking than an 82-game season.
Being "data-driven" isn't enough. You have to be data-informed and data-literate, able to ask why, when, and what else might be true?
1. Analytics Should Inform Strategy, Not Dictate It
The Celtics' three-point approach is based on season-long data. Over 82 games, the law of averages works in your favor. But playoff basketball compresses the sample size. A cold streak, a tough matchup, or subtle rhythm shifts can destroy that math in a matter of quarters.
As shown in the visualization below, the Celtics' three-point percentage plummeted from 36.8% in the regular season to just 25% in the second round of the playoffs, resulting in a dramatic drop of 0.35 points per possession. In Game 1 alone, this inefficiency cost them an estimated 21 points!
With smaller samples, variance plays a much larger role, making historical averages less reliable predictors of future performance.
Good strategy uses data as a compass, not a cage. It should point you in the right direction, but allow freedom to respond to terrain in real time.
2. Shot Quality and Rhythm Matter More Than Volume
Not all threes are created equal. Are the Celtics getting clean, in-rhythm looks? Or are defenders closing out harder, forcing rushed attempts?
When the data says, "we're a good three-point shooting team," it assumes consistent shot quality. But if your rhythm is off, your legs are tired, or the defense is dictating your spacing, your effective shooting percentage drops, no matter what your season average says.
Decision Framework - When to Trust Your Data
Are conditions similar to when the data was collected?
Is the sample size adequate for the decision at hand?
Are contextual factors (fatigue, pressure, defense) accounted for?
Does execution quality remain consistent?
Analytics must be paired with situational awareness.
3. The Human Element Is Invisible in the Data
The numbers don't know who's tired. They don't feel a player pressing after missing four in a row. They can't measure confidence, defensive intensity, or playoff nerves.
Analytics tells us what has happened and what might happen, but it still can't fully capture the human variables that determine what will happen in the moment. Data can't substitute for feel. That's why coaching still matters. A great coach reads body language, senses momentum, and knows when to slow the game down or change the tone. Analytics tell you what's likely; coaching decides what's needed now.
4. Threes Don't Draw Fouls. Drives Can Change the Game
One of the biggest strategic blind spots in sticking to three pointers is that you don't get to the foul line. When you're down, or losing momentum, drawing fouls can be a powerful tool:
It stops the clock
It gives you free points
It disrupts the opposing defense's rhythm
It can put key defenders in foul trouble
When players attack the basket, especially when the three pointers are not falling, you not only increase your odds of scoring, but also change the dynamics of the game.
Smart strategy isn't just about shot value, it's about game control. And in that moment, a drive to the hoop may be worth far more than another missed three.
5. Being Adaptable Is Being Data-Literate
The irony is that some of the most "data-driven" decisions are actually data-ignorant when they ignore live, contextual feedback. Analytics is not about doing what the data said yesterday, it's about interpreting what the data is telling you now.
The best teams know how to pivot mid-game:
Shift to driving and drawing contact
Run set plays to build confidence in struggling shooters
Lean into defensive stops to create transition opportunities
That's not abandoning data, it's using it responsibly and adaptively.
Business Has Its Own Version of This
The same thing happens in companies all the time.
Case Study - E-Commerce Customer Acquisition
Take a growing e-commerce brand that's relied on Instagram ads for customer acquisition. For years, data showed it delivered the best ROI. But as targeting rules changed, competitors crowded the space, and customer behavior shifted, performance declined.
Instead of adapting, the company doubles down on the same strategy, hoping for a return to the norm. Meanwhile, costs rise, conversion falls, and competitors outmaneuver them through fresher, more adaptive approaches.
Just like a cold-shooting team refusing to stop taking threes, the company clings to a data-backed strategy that no longer fits the current context.
Case Study - Healthcare Resource Allocation
A hospital system used historical admission data to staff departments efficiently. When patient demographics shifted due to a new insurance partnership, the original staffing model became misaligned with actual needs. Alert managers noticed the pattern change before the quarterly data review and adjusted staffing proactively, avoiding both patient care issues and unnecessary labor costs.
Case Study - Manufacturing Process Optimization
A manufacturing plant optimized its production schedule based on years of historical throughput data. When a major supplier changed their delivery schedule, the plant initially maintained their "data-optimized" production sequence, creating inventory bottlenecks. Only when they recognized that the underlying conditions had changed did they recalibrate their approach to match the new reality.
Being data-informed in business means asking:
Are our conditions the same as when we developed this strategy?
Is our execution still yielding the same quality of results?
Do we need to pivot to regain control of the situation?
Those who combine data with real-time awareness outperform those who only trust the historical average.
Key Takeaways - When Data Literacy Makes the Difference
Understand sample size implications - Know when your data is robust enough to rely upon and when it's vulnerable to variance
Question underlying assumptions - Regularly check if the conditions that made your data valid still hold true
Develop contextual awareness - Train your organization to spot when execution quality or environmental factors have changed
Build flexibility into data-driven processes - Create decision trees that account for changing conditions
Value both quantitative and qualitative signals - The best decisions integrate hard numbers with human judgment
Contrarian Views - What the Critics Might Say
To be truly data-literate, we also have to consider alternative viewpoints. Here are four valid counterarguments a coach, statistician, or analytics purist might raise, and why they don’t weaken the case, but actually help refine it.
1. “Regression to the Mean Means Keep Shooting”
Some statisticians might argue the Celtics should keep taking threes, even during a slump, because shooting performance regresses to the mean over time. Cold streaks happen, but the math says to ride it out.
Response That’s true over large sample sizes. But the playoffs don’t offer that luxury. In a 7-game series, or even a two-game swing, the cost of waiting for variance to correct itself can be season-ending. Good strategy recognizes when short-term volatility outweighs long-term averages, and adapts accordingly.
2. “You Can’t Abandon Your Identity in the Playoffs”
A coach might say pivoting away from a team’s identity in high-stakes moments sends the wrong message, players need consistency to maintain rhythm and confidence.
Response Adaptability doesn’t mean abandoning your identity, it means expressing it differently depending on the game state. You can remain a three-point-focused team and recognize when drives, mid-range looks, or foul-drawing plays help regain control.
3. “Playoff Defenses Force Bad Shots. This Is About Execution, Not Strategy”
Some analysts would argue that it’s not the strategy that’s broken, it’s the execution. The team is simply getting out-defended.
Response Exactly, and that’s the point. If execution quality drops (due to defense, fatigue, or rhythm), the expected value of the original strategy changes. Strategy is only as good as the conditions it assumes. Smart teams adjust when those conditions shift.
4. “You're Overinterpreting a Two-Game Sample”
A statistician might say drawing conclusions from two games risks overfitting the narrative. Two cold nights shouldn’t undo a full season’s worth of data.
Response That’s a fair caution. But playoff decisions must be made in small-sample environments. This isn’t about predicting failure, it’s about making better real-time decisions when past averages no longer reflect current performance.
These contrarian views aren’t threats to the argument, they’re complements. They remind us that being truly data-informed means considering multiple angles, questioning assumptions, and knowing when long-term strategies need short-term adjustments.
Analytics is most powerful not when it tells us what to do, but when it helps us decide when to change what we do.
Closing Play - Adaptability Is the Edge
The Celtics' three-point strategy has helped them succeed. But that same strength becomes a weakness when it turns into inflexibility.
Basketball, like business, rewards those who combine planning with presence, who know when to change the play not because the plan was wrong, but because the moment demands something else.
It's not about abandoning analytics. It's about using them with wisdom. Because whether you're blowing a 20-point lead in a playoff game or watching your Q2 revenue fall flat, sticking to the script only works when the script still fits the scene.
Kevin is an author, speaker, and thought leader on topics including data literacy, data-informed decisions, business strategy, and essential skills for today. https://www.linkedin.com/in/kevinhanegan/
Greatness is debated endlessly in sports and business but without clear measures, it’s just noise. This article breaks down the formula for true greatness: peak performance, sustained excellence, and adaptability.
You're trained in inductive and deductive logic, but your AI gives you 78% confidence scores and your data conflicts. Traditional reasoning breaks down with modern complexity. Learn why smart leaders need Integrated Reasoning to handle uncertainty and make better decisions.
You've felt it. Working through your trusted decision framework but still feeling uncertain. SWOT, decision trees, and data-driven approaches break down with AI outputs and information overload. Discover why traditional frameworks fail in today's complex environment and what works instead.
Traditional reasoning stops at the 'best' explanation. Integrated Reasoning starts there. When AI gives you probabilities and data is incomplete, you need a systematic way to think about thinking. Here's the 5-step framework that changes everything.
Becoming data literate begins in your inbox. Sign up to receive expert guidance, news, and other insights on the topics of data literacy and data-informed decision-making. Want to know more about our mission? Visit our About Page. Thanks for visiting!