Greatness is debated endlessly in sports and business but without clear measures, it’s just noise. This article breaks down the formula for true greatness: peak performance, sustained excellence, and adaptability.
Traditional logic assumes certainty. AI gives you probabilities. Our brains are wired for yes-or-no answers, but we got a world of 'maybe-probably.' The rules changed from deterministic to probabilistic, but our reasoning didn't evolve. Learn why your old thinking tools feel brittle.
You're trained in inductive and deductive logic, but your AI gives you 78% confidence scores and your data conflicts. Traditional reasoning breaks down with modern complexity. Learn why smart leaders need Integrated Reasoning to handle uncertainty and make better decisions.
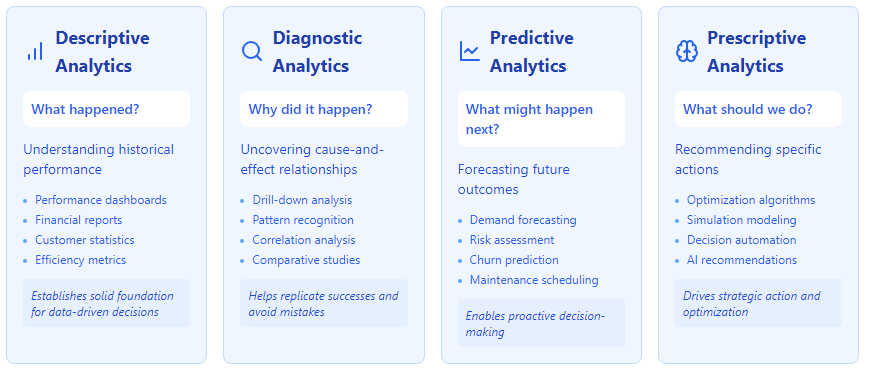
In today's business environment, data has become as valuable as traditional assets like inventory or equipment. However, having data alone isn't enough—the real value lies in how we transform that data into actionable insights. This transformation happens through four distinct levels of analytics, each building upon the previous one to provide increasingly sophisticated insights for decision-making.
Understanding the Analytics Progression
Think of business analytics as climbing a mountain of insight. At the base, we gather basic facts about what happened. As we climb higher, we gain deeper understanding about why events occurred, what might happen next, and ultimately, what actions we should take. This progression isn't just about using more sophisticated tools—it's about asking increasingly complex questions and finding more valuable answers.
Descriptive Analytics - Building the Foundation
What happened?
Descriptive analytics forms the bedrock of all data analysis. It's like looking in a rearview mirror—it shows us where we've been and what path we took to get here. While this might seem simple, effective descriptive analytics requires careful attention to detail and a clear understanding of what metrics matter most to your business.
At this level, we focus on transforming raw data into meaningful summaries that anyone in the organization can understand. This involves:
Data Aggregation: Combining individual data points into meaningful groups. For instance, instead of looking at thousands of individual sales transactions, we might summarize sales by product category, region, or time period.
Basic Statistical Methods: Using averages, percentages, rates of change, and other fundamental statistical measures to make sense of the data. These methods help us understand typical behavior and identify unusual patterns.
Data Visualization: Creating charts, graphs, and dashboards that make the information accessible and understandable at a glance. Good visualization helps stakeholders quickly grasp important trends and patterns.
Diagnostic Analytics - Uncovering the Story
Why did it happen?
Read the full story
Sign up
now to read the full story and get access to all posts for
paying subscribers only.
Greatness is debated endlessly in sports and business but without clear measures, it’s just noise. This article breaks down the formula for true greatness: peak performance, sustained excellence, and adaptability.
You're trained in inductive and deductive logic, but your AI gives you 78% confidence scores and your data conflicts. Traditional reasoning breaks down with modern complexity. Learn why smart leaders need Integrated Reasoning to handle uncertainty and make better decisions.
You've felt it. Working through your trusted decision framework but still feeling uncertain. SWOT, decision trees, and data-driven approaches break down with AI outputs and information overload. Discover why traditional frameworks fail in today's complex environment and what works instead.
Traditional reasoning stops at the 'best' explanation. Integrated Reasoning starts there. When AI gives you probabilities and data is incomplete, you need a systematic way to think about thinking. Here's the 5-step framework that changes everything.
Becoming data literate begins in your inbox. Sign up to receive expert guidance, news, and other insights on the topics of data literacy and data-informed decision-making. Want to know more about our mission? Visit our About Page. Thanks for visiting!