Unlock the power of AI in your business with our AI Opportunity Identification Framework. Learn how to systematically identify, evaluate, and prioritize AI applications that deliver real value.
Information bombards us from every angle, making the ability to discern fact from fiction crucial. With 75% of adults falling for fake news, data literacy emerges as our compass in the digital landscape. Learn how critical thinking can combat clickbait culture and empower informed decision-making.
Empower your career with the knowledge and tools to make data-informed decisions. Explore our articles, assessments, job aides, white papers, learning videos, data literacy GPT, expert-led consulting services, and much more. Click to discover how data can drive your success.
Becoming a Better Data Citizen. Navigating the World of Election Data. A Voter's Guide to Understanding Polls, Statistics, and Avoiding Misinformation
Elections today are fueled by data. This proliferation of data carries immense potential to inform voters. However, citizens must arm themselves with data literacy to avoid misinterpreting.
In the digital theater of modern elections, data literacy is not just a skill but a civic duty, empowering voters to navigate the sea of statistics with a critical eye and ensuring that their democratic choices are informed, not just influenced.
High-Level Summary and Key Takeaways
Modern elections swarm with data like polls, projections, and voter demographics. This proliferation carries the potential to inform voters’ choices. However, citizens need data literacy – critical interpretation, analysis, and evaluation abilities – to tap this potential amid the data deluge. Statistical concepts like sampling, margins of error, demographic biases, and more warrant comprehension.
Pre-election polls provide estimates, not guarantees. Their methodology should undergo scrutiny – from question framing, sampling techniques, undecided voter assessments, and more. Granular voter demographic data also requires thoughtful baseline comparisons, not superficial reading, to infer significant shifts.
Historical cases like the 2016 US elections and the Brexit referendum highlight polls can fail to capture nuances like state-level divides and close margins. This underscores treating probabilities as just that, not certainties. Broadly, sound data literacy enables asking probing questions on sourcing, biases, alternate factors and alignment with other indicators.
Ultimately, as data permeates elections, upholding democracy’s integrity hinges on citizens informed by wisdom. This requires navigating the middle path between blind trust in data and outright rejection. By cultivating data fluency, voters become sentinels of democracy, guarding elections from distortion. Savvy, ethical data usage elevates democracies.
Key Takeaways
Modern elections feature extensive data like polls and voter demographics, carrying the potential to inform voters' choices. However, citizens need data literacy to interpret this information critically.
Pre-election polls provide estimates, not guarantees. Voters should scrutinize methodology, sampling, demographic biases, and more to assess validity.
Historical cases demonstrate polls can fail to capture nuances like state divides and close margins. This underscores treating probabilities with discernment, not certainty.
Sound data literacy enables asking probing questions on data sourcing, alternate factors, and alignment with other indicators to identify misuse.
As data permeates elections, upholding democracy’s integrity requires citizens informed by wisdom in navigating between blind trust and outright data rejection. Data fluency makes voters sentinels guarding elections.
Listen to AI Narration
0:00
/445.968
Elections today are fueled by data. Pre-election polls, demographic analysis, turnout projections - numbers permeate every facet of the electoral process. This proliferation of data carries immense potential to inform voters. However, to tap this potential, citizens must arm themselves with data literacy – the ability to interpret, analyze and evaluate data critically.
Let’s explore key statistical concepts voters should grasp to make sense of the data deluge surrounding modern elections.
Decoding Pre-Election Polling: The Art and Science
Polls aim to take the pulse of the electorate and provide a snapshot of candidate support. But they have inherent limitations.
First, polls rely on sampling a subset of voters to represent the entire voting population. Generally, a sample of around 1,000 respondents is considered adequate to provide a reasonable estimate for a large country like the US. This concept is known as the ‘law of large numbers’ in statistics. The premise is that as the sample size grows larger, its characteristics will converge toward those of the overall population. So a sufficiently large sample can serve as a microcosm.
However, polls depend on random sampling, which is practically impossible to achieve. This introduces sampling error – the difference between a poll’s results and true population parameters. To account for this, polls have a margin of error, usually around +/- 3 percentage points.
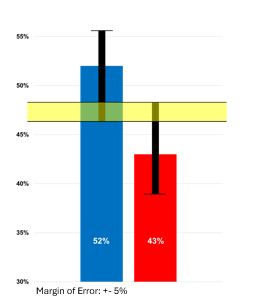
For instance, if a poll shows Candidate A at 52% and Candidate B at 48%, with a 3% margin of error, Candidate A's actual support could be as high as 55% or as low as 49%. This range matters in close electoral races.
Additionally, polls are expensive. So sample sizes are just large enough to give the desired 95% confidence that the true population preference falls within the margin of error. This leaves a 5% chance the actual sentiment lies outside.
Read the full story
Sign up
now to read the full story and get access to all posts for
subscribers only.
Data, like Pandora's Box, holds both perils and promise. While its misuse can harm, responsible management offers hope. Embracing ethical data use is crucial for harnessing its potential to improve society. Let's learn from Pandora and use data as a force for good.
Our world is awash with data. From social media stats to poll results, numbers dominate the discourse on major issues. But blindly accepting data leaves you vulnerable to manipulation. In the era of misinformation, developing data literacy is critical.
Information bombards us from every angle, making the ability to discern fact from fiction crucial. With 75% of adults falling for fake news, data literacy emerges as our compass in the digital landscape. Learn how critical thinking can combat clickbait culture and empower informed decision-making.
Data often revolves around numbers, providing clear insights. However, words play an equally important role in shaping our understanding of data. Despite their importance, words can lead to misunderstandings or misinformation.
Becoming data literate begins in your inbox. Sign up to receive expert guidance, news, and other insights on the topics of data literacy and data-informed decision-making. Want to know more about our mission? Visit our About Page. Thanks for visiting!