Organizations spend millions on analytics platforms but decisions keep getting worse. The problem isn't your data, it's your thinking infrastructure. Discover why cognitive leverage beats tool leverage every time.
Every team runs "shadow IT for the brain". Different frameworks, conflicting assumptions, decision chaos. Discover how to build a cognitive stack that scales human judgment like software infrastructure.
Most digital transformations fail not because of technology, but because leaders neglect the human operating system: beliefs, behaviors, and culture. True transformation is human-first, with tech as the enabler.
73% of enterprise data goes unanalyzed, creating a dangerous paradox: organizations are drowning in data but starving for insights. Meet Data Blindness—the costly phenomenon where an abundance of dashboards creates the illusion of control while hiding the insights that drive real business value
Data doesn’t solve problems. Insights do. And dashboards generally don’t deliver insights—they deliver distractions.
High-Level Summary and Key Takeaways
Organizations today face a dangerous paradox: drowning in data while starving for insights. Despite sophisticated dashboards and real-time analytics, business leaders struggle to make meaningful decisions and frequently miss critical opportunities.
This modern phenomenon, known as Data Blindness, manifests through multiple symptoms. Leaders spend hours reviewing metrics that fail to drive action. Teams prioritize easily measured data points over meaningful insights. Dashboards answer surface-level questions while deeper strategic challenges go unaddressed.
Three systemic paradoxes fuel this problem. The Measurement Paradox shows how an abundance of metrics actually obscures clarity. The Insight Paradox reveals that more data often leads to fewer meaningful discoveries. The Action Paradox demonstrates how excessive metrics paralyze decision-making rather than enabling it.
The solution lies not in creating more dashboards but in fundamentally rethinking how organizations approach data analysis. Question Engineering emerges as a powerful framework for moving beyond surface-level metrics to unlock transformative insights. This systematic approach helps leaders craft strategic questions that drive real business value.
The stakes are significant. Companies lose millions annually to missed opportunities hidden within their data. True competitive advantage comes not from having more data, but from asking better questions—questions that challenge assumptions, reveal hidden patterns, and guide meaningful action.
Key Takeaways
Most organizations operate under a dangerous illusion of data-driven decision making. While they invest heavily in dashboards and analytics tools, the reality is stark: less than 30% of dashboards inform actual decisions, and 73% of enterprise data sits unanalyzed. This data abundance paradoxically creates a false sense of insight while masking critical business realities that could drive real value and transformation.
Traditional approaches to data analytics often backfire through three distinct paradoxes. The Measurement Paradox shows that more metrics actually reduce clarity rather than improve it. The Insight Paradox reveals how increased data volume leads to fewer meaningful discoveries. The Action Paradox demonstrates that an abundance of metrics frequently paralyzes decision-making instead of accelerating it. Together, these paradoxes explain why organizations with sophisticated analytics often struggle to derive actionable insights.
The widespread "decoration trap" undermines dashboard effectiveness across industries. Rather than serving as tools for action, dashboards have become digital wallpaper - designed more for aesthetic appeal than actionable insights. This creates a vicious cycle where poorly defined questions lead to ineffective dashboards, which provide superficial answers, ultimately resulting in missed opportunities and flawed decisions worth millions in lost revenue.
Question Engineering emerges as a systematic solution to break free from Data Blindness. Instead of starting with available data and forcing insights, this approach focuses on crafting strategic questions that drive business value. The framework transforms how organizations approach data analysis, moving from passive metric monitoring to active insight generation through better, more strategic questioning.
Listen to AI Narration
0:00
/1034.928
A dangerous paradox has emerged in today's data-saturated business environment; organizations are drowning in data but starving for insights. This phenomenon, which we call 'Data Blindness,' is costing companies millions in missed opportunities and flawed decisions.
This article provides a high-level introduction to the symptoms, risks, and systemic challenges caused by Data Blindness. In Part 2, we will explore actionable strategies, including the transformative power of Question Engineering, to overcome these challenges and unlock meaningful insights.
Picture this, another Monday morning, another leadership meeting. The executive team huddles around screens filled with colorful charts and real-time metrics. Everyone nods along as numbers flash by, yet somehow, the big decisions remain unmade, and breakthrough insights feel just out of reach. If this scenario feels painfully familiar, you're not alone—you might be suffering from Data Blindness.
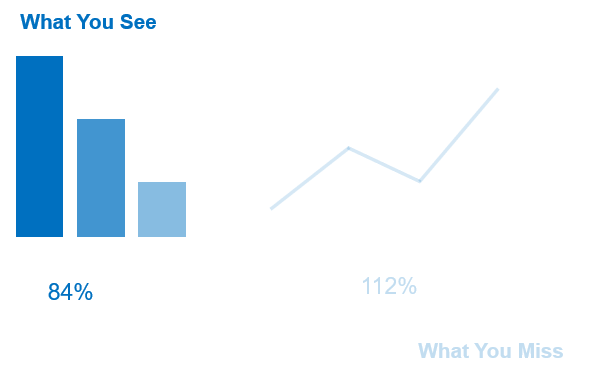
While dashboards may highlight visible metrics, they often miss hidden trends and opportunities—an illusion of control that drives Data Blindness
The Dashboard Mirage
Before reading further, take 30 seconds to answer these questions:
□ Do you have more than 5 dashboards you check regularly? □ Have your key metrics improved while overall performance declined? □ Do your meetings spend more time reviewing data than making decisions? □ Can your team explain how each metric drives business value? □ Has a dashboard ever predicted a major business challenge before it happened?
If you checked even one box, you're likely experiencing the Dashboard Mirage—a deceptive phenomenon where an abundance of data creates the illusion of insight while masking critical business realities.
The Illusion of Control Your dashboards are lying to you—or worse, they're blinding you to the insights you actually need. Every day, executives stare at sophisticated dashboards filled with real-time metrics, trending graphs, and colorful visualizations. The numbers dance across screens in executive boardrooms, creating a comforting sense of control and understanding. But this comfort is a mirage.
Consider this. When was the last time your dashboard told you something you didn't expect? When did it prompt a decisive action that transformed your business? If you're like most leaders, these questions give you pause.
The Decoration Trap Modern dashboards, while visually impressive, often fall into what we call the "decoration trap"—designed more for aesthetic appeal than actionable insights. Despite significant investments in sophisticated monitoring systems, many organizations remain disconnected from the insights they need to drive impactful decisions. The issue lies not with the dashboards themselves, but with their misaligned purpose.
Three indicators your organization might be in the decoration trap:
The Morning Ritual. Reviewing dashboards has become a routine, but this habit rarely results in meaningful action. If you can’t recall the last decision sparked by a dashboard insight, this is a warning sign.
The Metric Treadmill. Teams continually add metrics and dashboards, yet remain blindsided by strategic challenges. The constant expansion dilutes focus and hinders prioritization.
The Data Dance. Meetings revolve around presenting numbers rather than discussing their implications or deciding on the next steps. The result is a cycle of passive consumption rather than proactive decision-making.
Read the full story
Sign up
now to read the full story and get access to all posts for
subscribers only.
Organizations spend millions on analytics platforms but decisions keep getting worse. The problem isn't your data, it's your thinking infrastructure. Discover why cognitive leverage beats tool leverage every time.
Every team runs "shadow IT for the brain". Different frameworks, conflicting assumptions, decision chaos. Discover how to build a cognitive stack that scales human judgment like software infrastructure.
Most digital transformations fail not because of technology, but because leaders neglect the human operating system: beliefs, behaviors, and culture. True transformation is human-first, with tech as the enabler.
Companies keep buying skills and still stumble. The problem is not competence. It is missing humility, ethics, and adaptive mindsets. Learn the three-legged model for readiness and how to avoid dangerous competence
Becoming data literate begins in your inbox. Sign up to receive expert guidance, news, and other insights on the topics of data literacy and data-informed decision-making. Want to know more about our mission? Visit our About Page. Thanks for visiting!