Most digital transformations fail not because of technology, but because leaders neglect the human operating system: beliefs, behaviors, and culture. True transformation is human-first, with tech as the enabler.
Companies keep buying skills and still stumble. The problem is not competence. It is missing humility, ethics, and adaptive mindsets. Learn the three-legged model for readiness and how to avoid dangerous competence
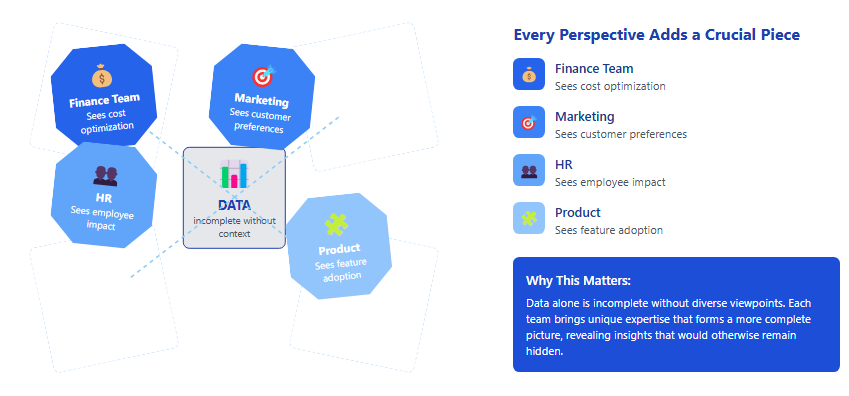
Data Is Objective, But Interpretation Is Subjective —That’s Why Diversity Matters
Smart companies don't just collect more data—they collect more perspectives. When different viewpoints examine the same data, hidden insights emerge that homogeneous teams miss. Your data is only as good as the minds analyzing it.
If you're making decisions based on data interpreted by people who all think alike, you don't have insights—you have an echo chamber with spreadsheets.
High-Level Summary and Key Takeaways
While data itself may be objective, our interpretation is inherently subjective. The real power of data analytics emerges when diverse perspectives examine the same information. Companies often assume data tells the complete story, but what we choose to measure and how we analyze it already shapes the narrative.
Intuition, our brain's internal data processing system, draws from personal experience but remains fallible. When teams with similar backgrounds interpret data, they risk reinforcing existing biases rather than uncovering new insights. Research consistently shows that cognitively diverse teams outperform homogenous groups of experts, as demonstrated in studies by Scott E. Page and others.
Historical examples like the Challenger disaster and the 2008 financial crisis demonstrate how ignoring diverse perspectives can lead to catastrophic decisions, even among brilliant minds. Diverse teams deliberate longer, consider more evidence, and ultimately make fewer errors, though the process may feel less comfortable.
Organizations can harness this collaborative intelligence by expanding hiring strategies beyond typical pools, encouraging constructive dissent, and breaking down departmental silos. The key isn't simply collecting more data but ensuring varied viewpoints analyze it from multiple angles.
True data-informed decision making requires questioning assumptions, identifying missing perspectives, and challenging intuition. The most valuable insights emerge not from numbers alone, but from the diverse minds interpreting them.
Key Takeaways
Data itself is objective, but our interpretation is always subjective—shaped by our experiences, biases, and mental models. The same dataset can yield entirely different conclusions when viewed through different lenses.
Diverse perspectives are essential for complete data analysis. Research shows that cognitively diverse teams consistently outperform homogeneous groups of experts, as they challenge assumptions and consider alternative viewpoints.
Historical failures like the Challenger disaster and the 2008 financial crisis demonstrate how dangerous groupthink can be, even among intelligent individuals. These cases highlight the need for dissenting voices in decision-making processes.
Intuition is our brain's internal data processing system based on past experiences, but it's not always reliable. What feels like an "obvious" interpretation of data is often just a reflection of our own biases.
Organizations can build collaborative intelligence by expanding hiring strategies beyond typical pools, encouraging constructive dissent, and breaking down departmental silos to ensure that multiple perspectives inform data-driven decisions.
Listen to AI Narration
0:00
/610.392
The Power of Perspective in Data Interpretation
Early in my career, I led an education team tasked with understanding why our training programs for our company's software product weren’t selling, despite significant investment. Our data showed strong interest in the software itself but disappointing enrollment numbers for the associated training courses. For weeks, our team of seasoned instructional designers—all with similar backgrounds in corporate education—analyzed the same datasets and concluded that our training curriculum needed to be condensed and modernized.
Frustrated by our lack of progress, I organized what we called a "360-degree stakeholder review," bringing together instructors who delivered the training, sales representatives responsible for selling it, curriculum developers who built it, customers who had purchased it, and partners who integrated it into their offerings. Within one meeting, we had our breakthrough.
Instructors pointed out that participants struggled most with applying the software to their specific industry contexts—something our curriculum team hadn't emphasized
Sales representatives revealed that prospects were actually concerned about the time commitment, not the content itself
Customers shared that they valued the certification aspect far more than we realized
Partners highlighted that our training schedule conflicted with their implementation timelines
The same enrollment and feedback data, viewed through different lenses, told an entirely different story. What I thought was a curriculum design problem was actually a mix of scheduling, marketing, and value proposition issues that no amount of content redesign would have fixed.
That experience made me realize something crucial: even when we think we are being data-informed, we are often just reinforcing our existing perspectives. It’s not the data that changes—it’s who’s looking at it.
Without multiple perspectives, your data is just a collection of numbers – not insights
The Illusion of Objectivity
One of the biggest misconceptions about data is that it is purely objective and neutral—that numbers, charts, and analytics always tell the truth. But while data itself may be objective, our interpretation of it is always subjective.
Raw data is neutral, but the second you decide what to collect, what to ignore, and how to analyze it, you've already shaped the story. The question isn't whether bias exists—it's whose bias is running the show.
Data points—like sales figures, website traffic, or employee turnover rates—are just facts. But the moment we decide what to measure, how to collect it, and how to analyze it, we introduce human judgment. And human judgment is never neutral.
Take a simple statistic: Company X had 15% employee turnover last year
Read the full story
Sign up
now to read the full story and get access to all posts for
subscribers only.
Most digital transformations fail not because of technology, but because leaders neglect the human operating system: beliefs, behaviors, and culture. True transformation is human-first, with tech as the enabler.
Companies keep buying skills and still stumble. The problem is not competence. It is missing humility, ethics, and adaptive mindsets. Learn the three-legged model for readiness and how to avoid dangerous competence
Two leaders read the same AI analysis. One pivots and wins. One doubles down and loses. The gap is not skills. It is traits and mindsets like humility, resilience, courage, and long-term thinking.
Becoming data literate begins in your inbox. Sign up to receive expert guidance, news, and other insights on the topics of data literacy and data-informed decision-making. Want to know more about our mission? Visit our About Page. Thanks for visiting!