Organizations spend millions on analytics platforms but decisions keep getting worse. The problem isn't your data, it's your thinking infrastructure. Discover why cognitive leverage beats tool leverage every time.
Every team runs "shadow IT for the brain". Different frameworks, conflicting assumptions, decision chaos. Discover how to build a cognitive stack that scales human judgment like software infrastructure.
Most digital transformations fail not because of technology, but because leaders neglect the human operating system: beliefs, behaviors, and culture. True transformation is human-first, with tech as the enabler.
We often hear the phrase "let the data speak." However, data rarely speaks for itself—it requires careful interpretation to reveal its stories and insights. Understanding how to effectively summarize and interpret business data is becoming as crucial as collecting it, yet many professionals struggle with transforming numbers into meaningful insights that drive action.
Understanding the Foundation - What Makes Data Meaningful
Before diving into specific techniques, we need to understand what makes data interpretation valuable. Think of business data like the pieces of a puzzle: individual numbers might be interesting, but their true value emerges when we see how they fit together to create a complete picture. Effective interpretation helps us see both the individual pieces and the larger image they form.
Consider a sales dataset. Individual transaction records might show us what happened at specific moments, but interpretation helps us understand the broader patterns: Are certain products typically purchased together? Do sales follow seasonal patterns? Are customer preferences shifting over time? These insights emerge not from the raw numbers themselves, but from how we analyze and interpret them.
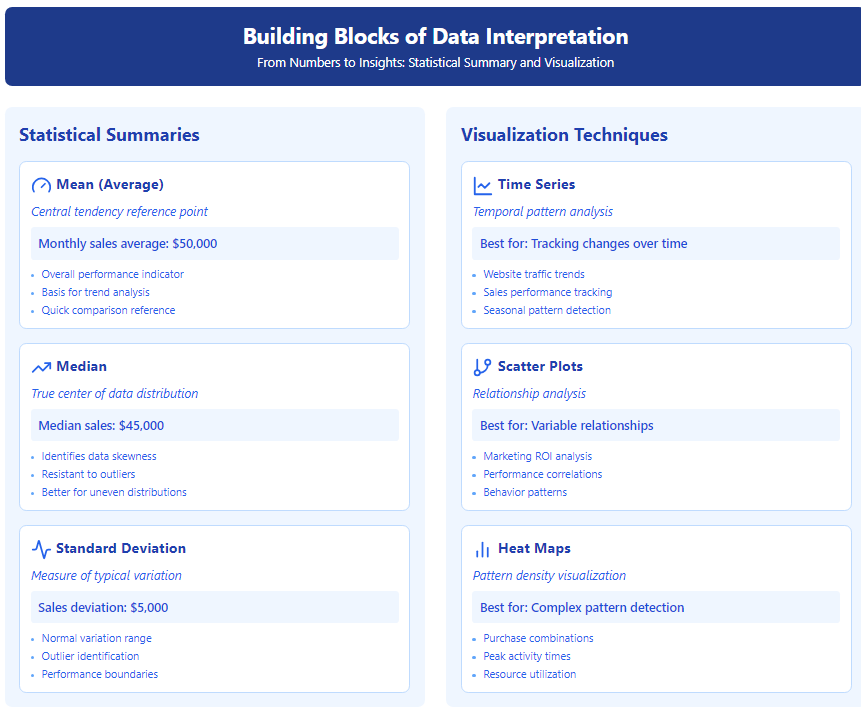
The Building Blocks of Data Interpretation
Successful data interpretation relies on three fundamental components: summarization, visualization, and contextual analysis. Let's explore how these work together to create meaningful insights.
Read the full story
Sign up
now to read the full story and get access to all posts for
paying subscribers only.
Organizations spend millions on analytics platforms but decisions keep getting worse. The problem isn't your data, it's your thinking infrastructure. Discover why cognitive leverage beats tool leverage every time.
Every team runs "shadow IT for the brain". Different frameworks, conflicting assumptions, decision chaos. Discover how to build a cognitive stack that scales human judgment like software infrastructure.
Companies keep buying skills and still stumble. The problem is not competence. It is missing humility, ethics, and adaptive mindsets. Learn the three-legged model for readiness and how to avoid dangerous competence
Becoming data literate begins in your inbox. Sign up to receive expert guidance, news, and other insights on the topics of data literacy and data-informed decision-making. Want to know more about our mission? Visit our About Page. Thanks for visiting!