Schools speak in scores. Parents speak in patterns. When your child's test results say 'fine' but you see daily struggles, something's missing. Learn to spot what assessment data hides and become your child's strongest advocate with data-smart parenting skills.
Your team doesn’t have a skills gap, they have a belief gap. Data literacy isn’t about skills, it’s about rewiring how people think. Discover why belief, not training, drives change.
Most organizations aren’t data-driven—they’re data-addicted. Discover why more dashboards, metrics, and storage aren’t helping you make better decisions and how to break the cycle that’s paralyzing your team.
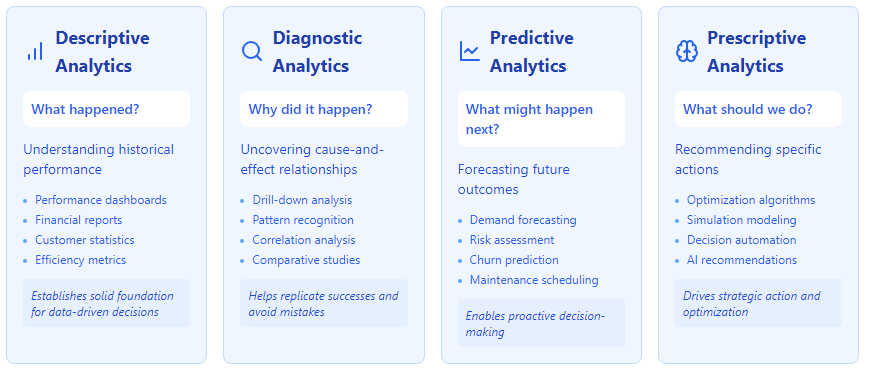
In today's business environment, data has become as valuable as traditional assets like inventory or equipment. However, having data alone isn't enough—the real value lies in how we transform that data into actionable insights. This transformation happens through four distinct levels of analytics, each building upon the previous one to provide increasingly sophisticated insights for decision-making.
Understanding the Analytics Progression
Think of business analytics as climbing a mountain of insight. At the base, we gather basic facts about what happened. As we climb higher, we gain deeper understanding about why events occurred, what might happen next, and ultimately, what actions we should take. This progression isn't just about using more sophisticated tools—it's about asking increasingly complex questions and finding more valuable answers.
Descriptive Analytics - Building the Foundation
What happened?
Descriptive analytics forms the bedrock of all data analysis. It's like looking in a rearview mirror—it shows us where we've been and what path we took to get here. While this might seem simple, effective descriptive analytics requires careful attention to detail and a clear understanding of what metrics matter most to your business.
At this level, we focus on transforming raw data into meaningful summaries that anyone in the organization can understand. This involves:
Data Aggregation: Combining individual data points into meaningful groups. For instance, instead of looking at thousands of individual sales transactions, we might summarize sales by product category, region, or time period.
Basic Statistical Methods: Using averages, percentages, rates of change, and other fundamental statistical measures to make sense of the data. These methods help us understand typical behavior and identify unusual patterns.
Data Visualization: Creating charts, graphs, and dashboards that make the information accessible and understandable at a glance. Good visualization helps stakeholders quickly grasp important trends and patterns.
Diagnostic Analytics - Uncovering the Story
Why did it happen?
Read the full story
Sign up
now to read the full story and get access to all posts for
paying subscribers only.
Schools speak in scores. Parents speak in patterns. When your child's test results say 'fine' but you see daily struggles, something's missing. Learn to spot what assessment data hides and become your child's strongest advocate with data-smart parenting skills.
Are your metrics telling different stories? Becoming a data whisperer means learning to hear what others miss: the signals behind the noise, the insight behind the contradiction, and the full picture behind the numbers.
Most data training teaches tools, not thinking. This article explores the missing layer of data fluency: how we approach, interpret, and act on data, and introduces human-centered models to build confident, adaptive data thinkers.
The Boston Celtics are losing not because they ignored analytics, but because they used them without context. This article explores the danger of blindly following data and the critical difference between being data-driven and truly data-literate.
Becoming data literate begins in your inbox. Sign up to receive expert guidance, news, and other insights on the topics of data literacy and data-informed decision-making. Want to know more about our mission? Visit our About Page. Thanks for visiting!